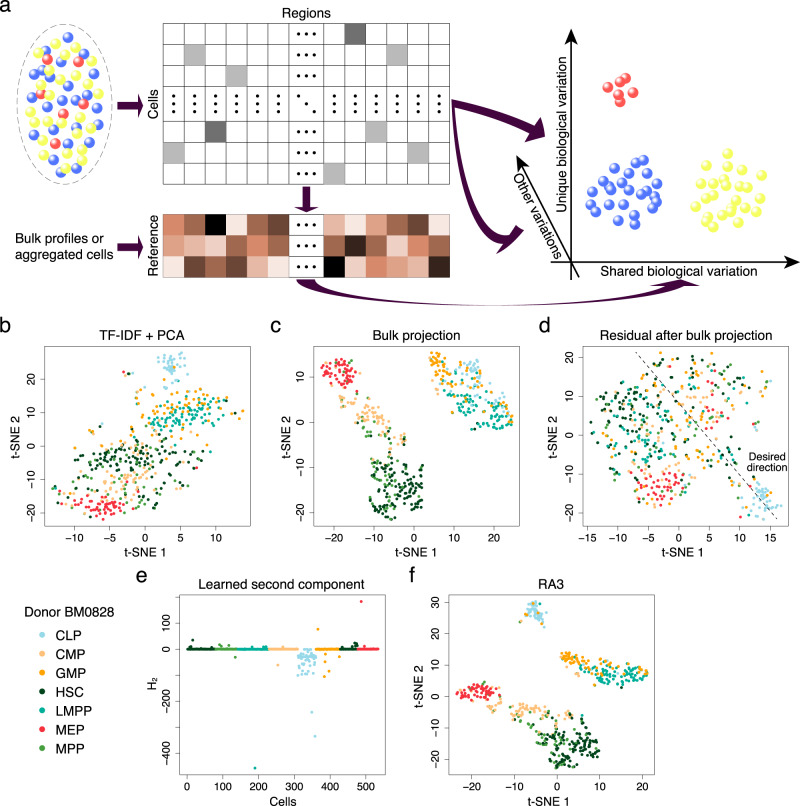
Fig. 1. The reference-guided approach for the analysis of scCAS data.
a A graphical illustration of the RA3 model. RA3 decomposes the variation in scCAS data into three components: the component that captures the shared biological variation with reference data, the component that captures the unique biological variation in single-cell data, and the component that captures other variations. b t-SNE visualization of the cells from donor BM0828 using latent features obtained from TF-IDF + PCA. c t-SNE visualization of the cells from donor BM0828 using latent features obtained from bulk projection. d We calculated the residuals after the bulk projection. PCA was performed on the residuals, followed by t-SNE visualization. e The learned second component with the spike-and-slab prior in RA3. f t-SNE visualization using the first two components learned by RA3. TF-IDF term frequency-inverse document frequency transformation, PCA principal component analysis.

