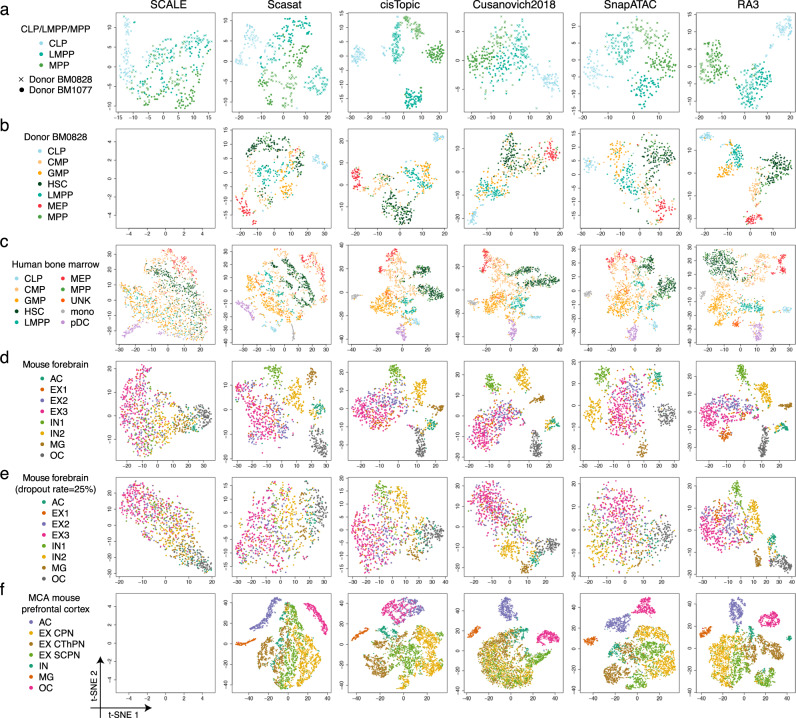
Fig. 3. Evaluation of the visualization of scCAS data.
a The dataset of CLP/LMPP/MPP cells. b The dataset of donor BM0828. c The human bone marrow dataset. d The mouse forebrain dataset (half). e The mouse forebrain dataset (half) with 25% dropout rate. f The dataset of mouse prefrontal cortex. For all the datasets, we obtained the latent features from SCALE, Scasat, cisTopic, Cusanovich2018, SnapATAC, and RA3, and then implemented t-SNE for visualization.

