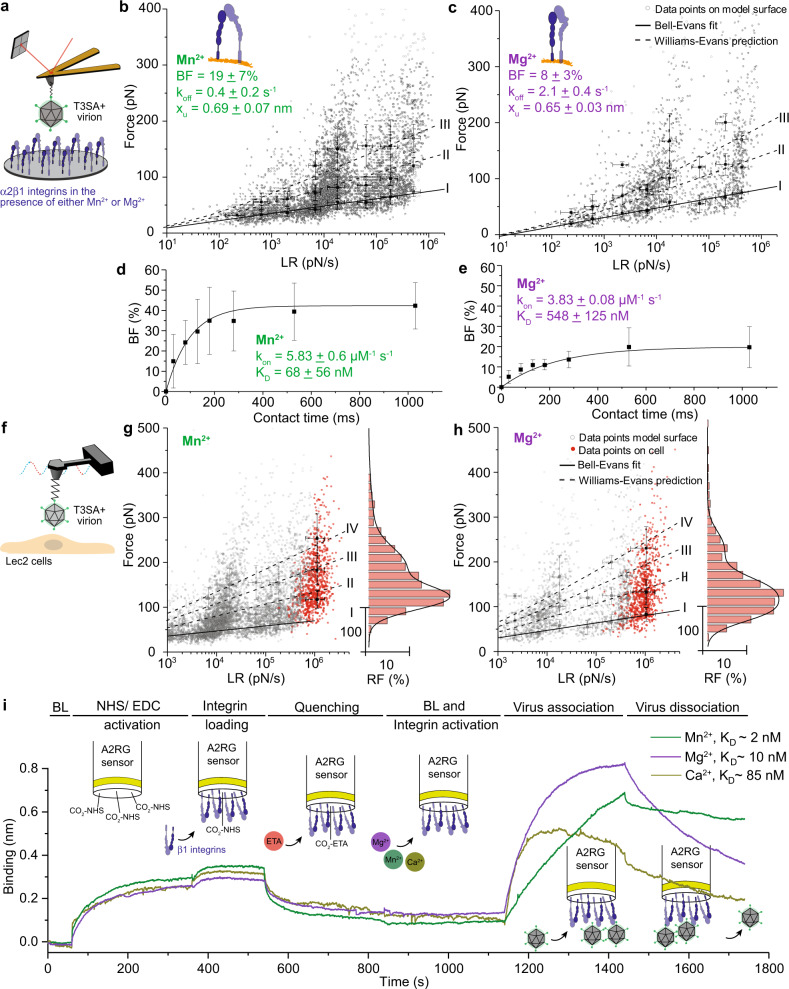
Fig. 3. Kinetic and thermodynamic insights into cation-dependent reovirus-integrin interactions.
Studies were conducted using AFM on model surfaces (a–e) and living cells (f–h) and using BLI (i). a Schematic of experimental set up to probe cation-dependent reovirus interactions with α2β1 integrin-coated model surface. b, c Dynamic force spectroscopy (DFS) plots show distribution of average rupture forces determined at eight distinct loading rate (LR) ranges for interactions between T3SA+ virions and β1 integrin-coated model surface in the presence of Mn2+ (for further details, see methods section) (b) or Mg2+ (c). Data corresponding to single interactions were fit with the Bell–Evans (BE) model (I, black curve), providing average koff and xu values. Dashed lines represent predicted binding forces for two (II) and three (III) simultaneous uncorrelated interactions (Williams-Evans [WE] prediction). d, e The binding probability is plotted as a function of the contact time. Least-squares fit of the data to a mono-exponential decay curve (line) provides average kinetic on-rate (kon) of the probed interaction. Comparison of KD (koff/kon) values shows that Mn2+ increases the affinity of T3SA+ virions for β1 integrins. f–h Assessment of cation-dependent reovirus interaction with integrins expressed on living cells. DFS plots of data obtained using model surfaces (gray circles and living cells (red dots) in the presence of either Mn2+ (g) or Mg2+ (h). Histogram of the force distribution observed on cells and a multi-peak Gaussian fit of data (n = 900 data points) are shown at the side. Error bars indicate s.d. of the mean value. All data are representative of N = 5 independent experiments. i Sensorgrams obtained using biolayer interferometry (BLI) show interaction of T3SA+ with β1 integrins immobilized on amine-reactive biosensors under conditions shown.

