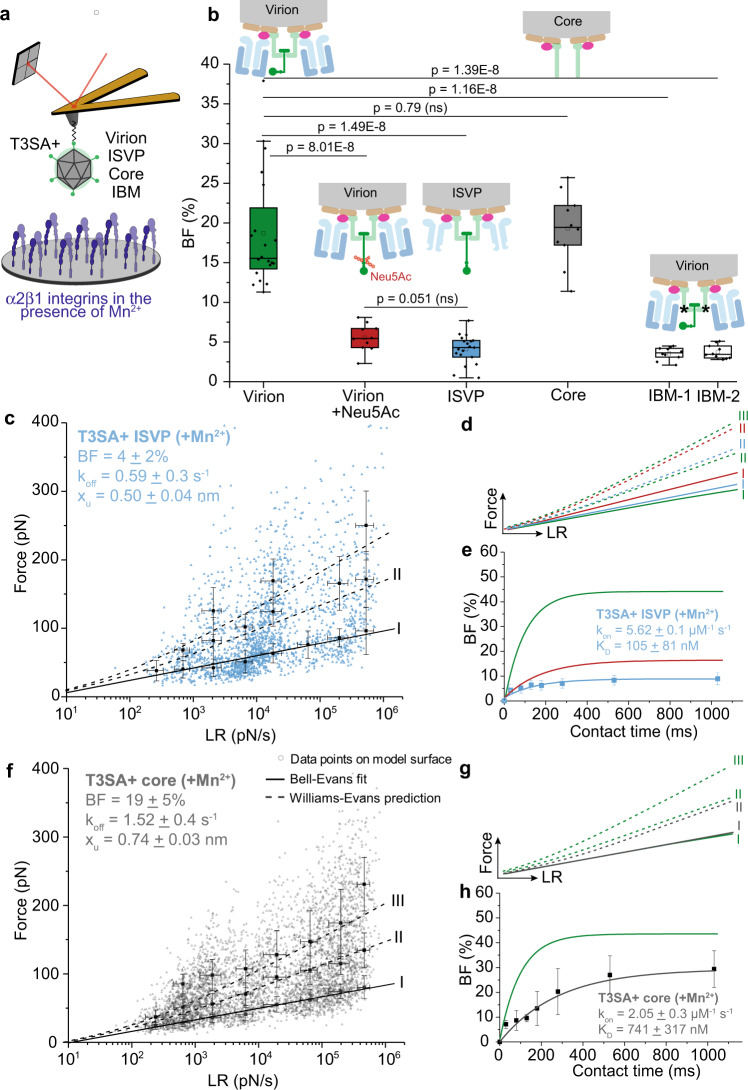
Fig. 5. Analysis of β1 integrin interactions with reovirus disassembly intermediates suggests λ2 as the viral integrin ligand.
a Schematic depicts the experimental set up. All experiments were conducted in the presence of Mn2+. b Box plot of BF between β1 integrins and T3SA+ virions, ISVPs, cores, or IBM-1/-2 (integrin binding motif mutant) quantified using AFM under the conditions shown. The horizontal line within the box indicates the median, boundaries of the box indicate the 25th and 75th percentile, and whiskers indicate the highest and lowest values. An open square within each box indicates the mean. c–e Binding of T3SA+ ISVPs to β1 integrins (colored in blue) in comparison with virions before (colored in green) and after (colored in red) incubation with Neu5Ac. c DFS plot of the interaction forces between integrins and T3SA+ ISVPs show that ISVPs display a different kinetic bond rupture behavior compared with T3SA+ virions in the absence of Neu5Ac but the same behavior as T3SA+ virions in the presence of Neu5Ac (as shown in d). e kon and KD determined from measuring BF as a function of contact time indicates that the affinity of ISVPs for integrin is comparable to that of virions in the presence of Neu5Ac. f–h Binding of T3SA+ cores (colored in gray) to β1 integrins differs from that of T3SA+ virions (colored in green). Plots display DFS data (f), comparison of T3SA+ cores (gray) with virions (green) (g), and kinetic on-rate measurements (h). Control experiments are shown in Supplementary Fig. 5. Error bars indicate s.d. of the mean. All data are representative of N = 3 independent experiments. Ten AFM tips were analyzed per condition. P values were determined by two-sample t-test using Origin .

