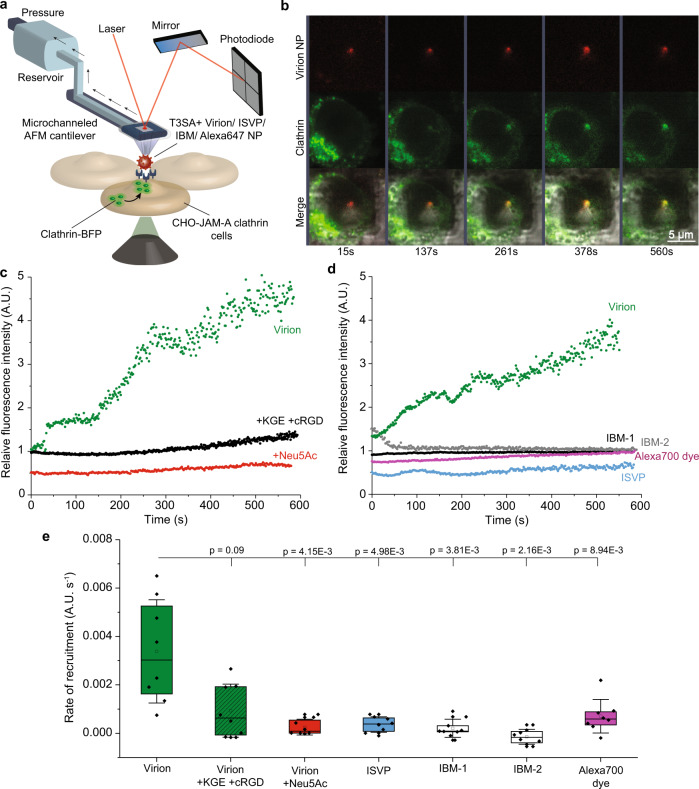
Fig. 6. Integrins function in clathrin recruitment by reovirus bound to cells.
Integrin-induced recruitment of clathrin (labelled with blue fluorescent protein [BFP]) at the plasma membrane following reovirus binding was quantified using Fluid-FM coupled with confocal microscopy. a Fluid-FM coupled to a confocal imaging setup. Fluorescent T3SA+ reovirus particles covalently coupled to gold-coated nanoparticles were trapped using a micro-channeled cantilever and brought in contact with clathrin-BFP-expressing CHO-JAM-A cells. Fast-scanning confocal microscopy was used to simultaneously visualize reovirus and clathrin fluorescence signals. b Representative time-lapse images from fluid-FM/confocal imaging show recruitment of clathrin (BFP, for better visibility shown in green instead of blue) to a reovirus (Alexa 647, red) contact site. c Recruitment of clathrin observed over time using blue fluorescence intensity around beads coated with T3SA+ virions in the absence (green) or presence of integrin-blocking peptides KGE and cRGD (black) or Neu5Ac (red). d Recruitment of clathrin observed over time using blue fluorescence intensity around beads coated with T3SA+ virions (green) and control particles ISVP (blue), IBM-1 (black), IBM-2 (gray), or Alexa 700 dye (purple). Representative images from control experiments are displayed in Supplementary Figs. 6 and 7. e Box plot shows the rate of clathrin recruitment calculated from the quantification of fluorescence over time (slopes of intensity vs. time curves fit to linear regressions). The horizontal line within the box indicates the median, boundaries of the box indicate the 25th and 75th percentile, and whiskers indicate the highest and lowest values. An open square within each box indicates the mean. Error bars indicate s.d. of the mean value. All data are representative of N = 10 independent experiments. P values were determined by two-sample t-test using Origin.

