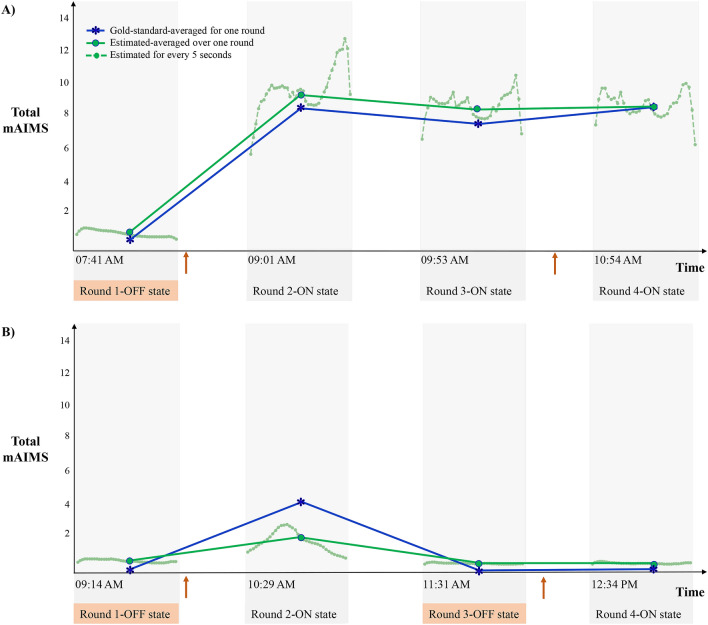
Figure 3.
The estimated and gold-standard dyskinesia severity scores for two subjects (A,B). The estimated dyskinesia score over time by the LSTM model (solid-green lines) in comparison with the gold-standard mAIMS scores (solid-blue lines) averaged for each round of activities. The 5-s estimations of the dyskinesia scores are shown in the background in dotted lines. The beginning of each activity was shown only during round 2 of the first subject. The orange arrows indicate the PD medication intake time as prescribed by the treating physician.

