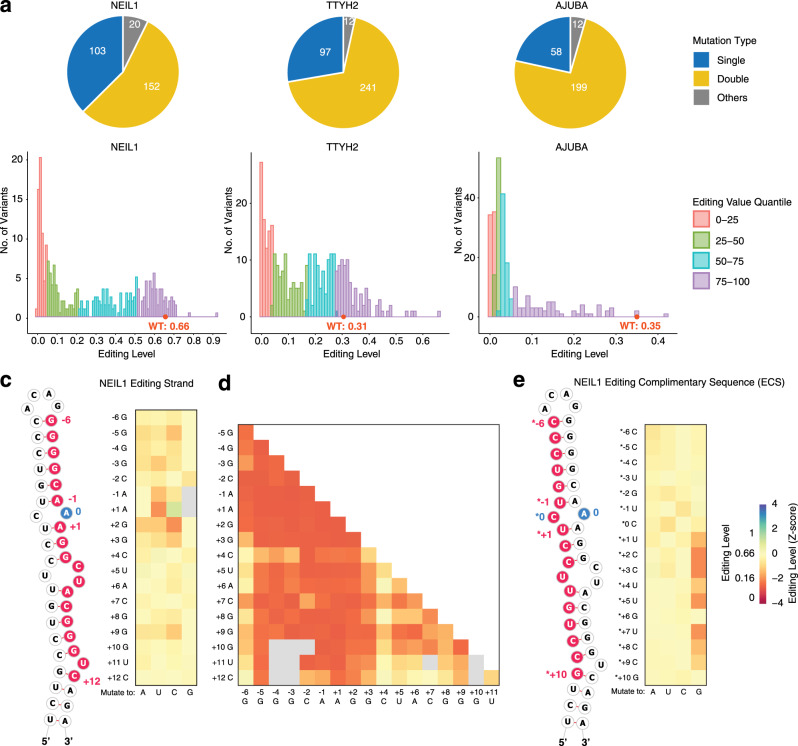
Fig. 2. RNA editing results from the targeted mutagenesis experiments.
a Number of the types of mutations made in each targeted mutagenesis library, including single mutations (blue), double mutations (yellow), and other mutants such as indels (gray). b Distributions of editing levels for each targeted mutagenesis library, colored by editing level quantile in each RNA library. Pink, 25% quantile; green, 25–50% quantile; blue, 50–75% quantile; purple, 75–100% quantile. c, d Heatmap of editing levels from c single and d double mutations in the editing strand of NEIL1. e Heatmap of editing levels from single mutation in the editing complementary sequence (ECS) of NEIL1. Editing level of WT NEIL1 is 0.66 ± 0.06. The Z-score is calculated as described in “Methods” and the WT editing level Z-score is 0. c–e shares the same heatmap color scale shown in e, reflecting average editing level from six biological replicates. In c and e, the mutagenized region is highlighted in red and the editing site in blue in the partial illustration of the secondary structure of NEIL1 RNA.

