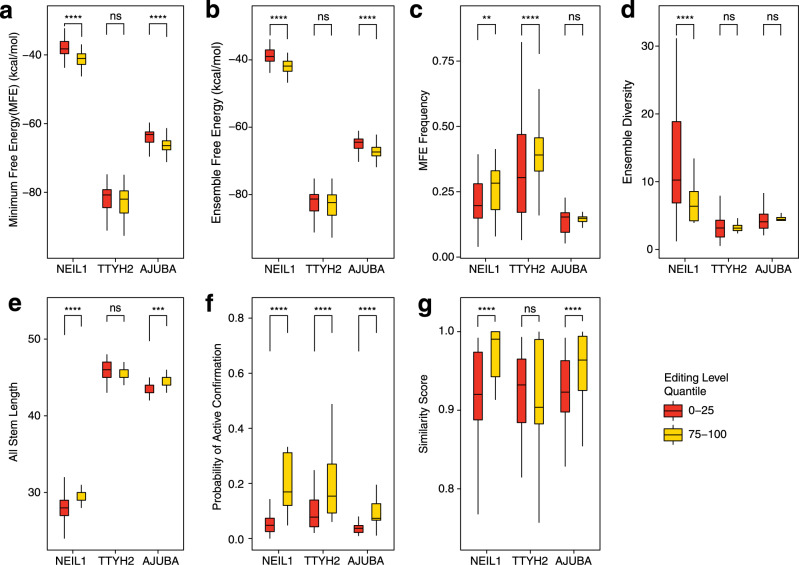
Fig. 5. Cis-regulatory features explain differences of editing levels among RNA variants.
a–g Comparing the difference of the highly edited (75–100 percentile in editing level in the library, yellow box) with the lowly edited (0–25 percentile, red box) variants in each RNA library in terms of thermodynamic and structural features. Two-sided Wilcoxon rank-sum test: ns nonsignificant; **P < 0.01; ***P < 0.001; ****P < 0.0001, and the exact P values for each feature are: a minimum free energy (MFE), P values: NEIL1 = 4.3e−12, TTYH2 = 0.44, AJUBA = 9.3e−07; b ensemble free energy, P values: NEIL1 = 2.2e−12, TTYH2 = 0.67, AJUBA = 7.2e−07; c MFE frequency, P values: NEIL1 = 0.0013, TTYH2 = 6.8e−05, AJUBA = 0.8751; c MFE frequency, P values: NEIL1 =, TTYH2 =, AJUBA =; d ensemble diversity, P values: NEIL1 = 9.3e−05, TTYH2 = 0.72, AJUBA = 0.19; e all stem length, P values: NEIL1 = 4.6e−09, TTYH2 = 0.81011, AJUBA = 0.00024; f probability of active conformation, P values: NEIL1 = < 2e−16, TTYH2 = 1.3e−08, AJUBA = 3.8e−11; g similarity score, P values: NEIL1 = 1.3e−09, TTYH2 = 0.87, AJUBA = 2.5e−06. Boxplot: center line, median; box limits, upper and lower quantiles; whiskers, ±1.5× IQR. The editing level are the average editing level from six biological replicates.

