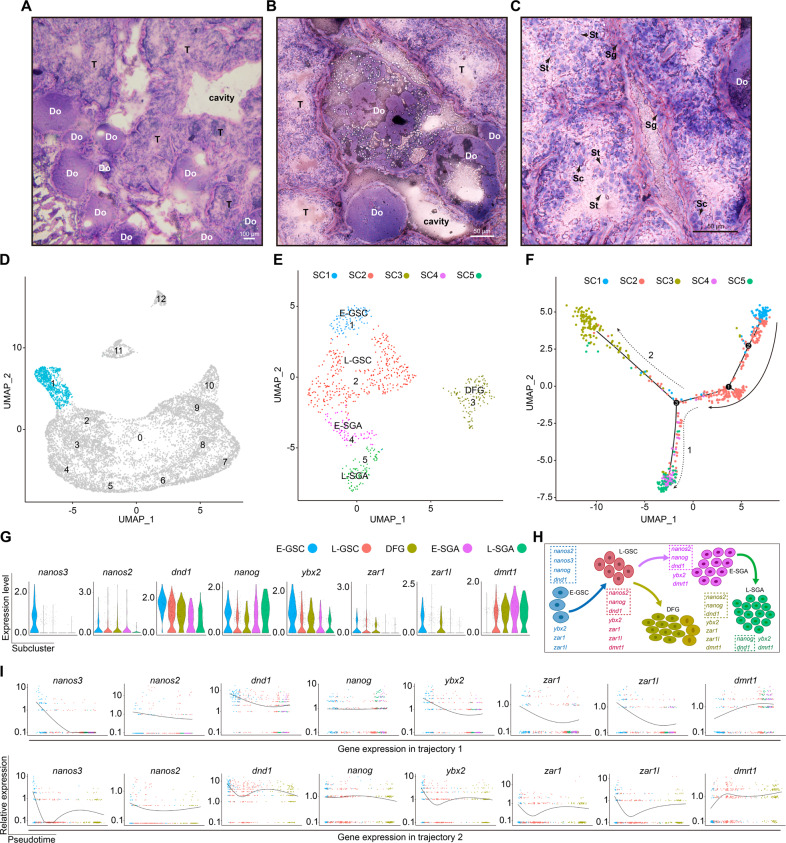
Fig. 1. Identification of germline stem cells in ovotestis.
A Ovotestis section stained by hematoxylin and eosin. DO degrading follicles, T testicular tissue. Scale bar, 100 µm. B Degrading follicles with various phenotypes in ovotestis. Scale bar, 50 µm. C Various spermatogenic cells, but lack of elongate spermatids in ovotestis. Sg spermatogonia, Sc spermatocytes, St round spermatids. Scale bar, 50 µm. D UMAP map showing cells in cluster 1 (blue). E Focused analysis of the cells in cluster 1 by UMAP clustering showed five subclusters: early-GSC (E-GSC), late-GSC (L-GSC), early-spermatogonia A (E-SGA), late-spermatogonia A (L-SGA), and degrading female germline cells (DFG). F Pseudotime trajectory analysis of five subclusters by Monocle revealed two differentiation trajectories (1 and 2). G Violin plots indicating expression levels of representative genes in these subclusters. H Schematic representation of stem cell lineage differentiation from E-GSC, via L-GSC, to L-SGA or to female germline stem cells. Stem cell factors are circled by dot lines. I Expression patterns of representative genes along the pseudotime axis. Top panels indicate pseudotime trajectory 1, and bottom panels show pseudotime trajectory 2.

