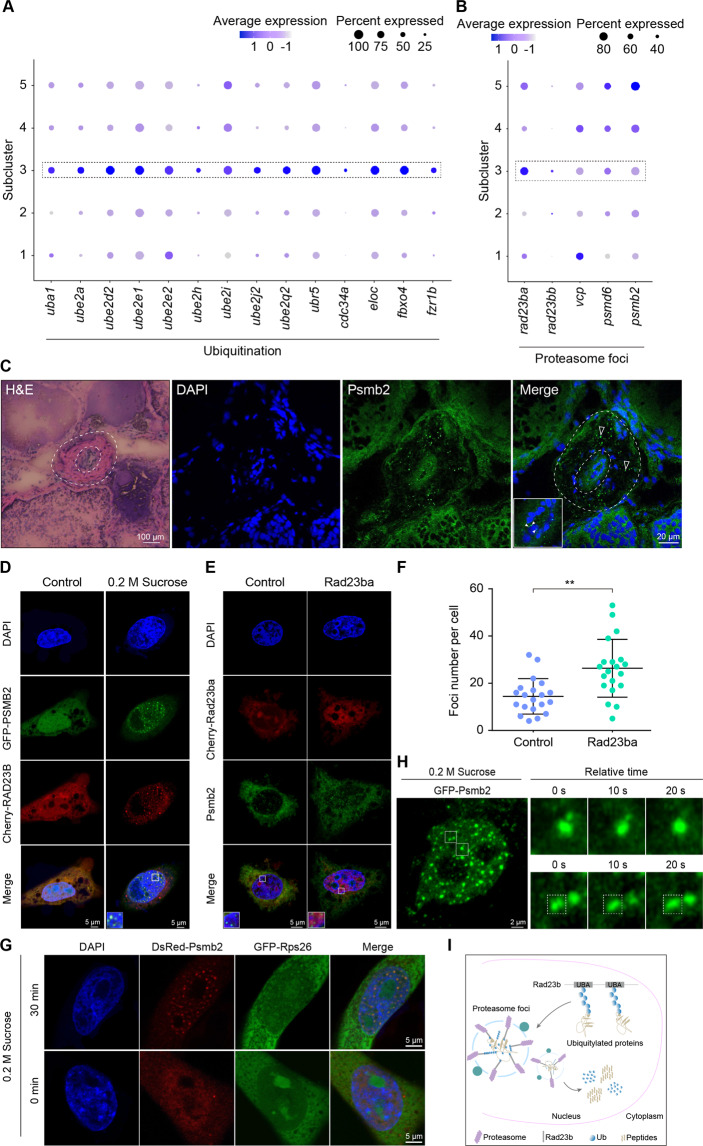
Fig. 2. Nuclear phase separation of the proteasome for degradation of female germline cells.
A Dotplot showing the expression of ubiquitination associated genes among subclusters. B Expression levels of key genes in proteasome foci formation among subclusters. C Immunofluorescence analysis of proteasome foci using Psmb2 antibody in ovotestis (secondary antibody, FITC-conjugated immunoPure goat anti-rabbit IgG(H + L)). Proteasome foci were located in the nuclei of germ cells (white solid arrowheads) and in the cytoplasm of supporting cells (white hollow arrowheads). The nuclei were stained with DAPI. The outer dotted circle indicates the degrading region and the inner dotted circle shows the germinal cradle. Scale bar: H&E, 100 µm; immunofluorescence, 20 µm. D Formation of proteasome foci in the nuclei of CHO cells. The cells were treated with 50 µM MG-132 for 1 h and then stimulated with 0.2 M sucrose for 30 min. PSMB2 (green) and RAD23B (red) were colocalized in the nuclei. The nuclei were stained by DAPI. The enlarged images originated from the regions with white square. Scale bar, 5 µm. E Overexpression of Rad23ba promotes the formation of proteasome foci. Endogenous proteasome foci were detected by PSMB2 antibody in CHO cells. PSMB2 (green) and Rad23ba (red) were colocalized in the nuclei. The nuclei were stained with DAPI. The cells were treated with 50 µM MG-132 for 1 h and then stimulated with 0.2 M sucrose for 30 min. The enlarged images originated from the regions with white square. Scale bar, 5 µm. F Statistical analysis showing the proteasome foci number per cell. Twenty cells were counted for each group. Data were mean ± SD, **P < 0.01. G Co-localization of Psmb2 (red) and Rps26 (green) in nucleus. The cells were stimulated with 0.2 M sucrose for 30 min. The nuclei were stained by DAPI. Scale bar, 5 µm. H Proteasome foci fusion in living CHO cells expressing GFP-Psmb2. The cells were treated with 0.2 M sucrose. Right panel, enlarged time-course views of the square in the left panel. Scale bar, 2 μm. I The diagram indicating the nuclear phase separation of proteasome and ubiquitylated protein degradation. The proteasome foci consist of Rad23b, polyubiquitin chain proteins, and proteasome.

