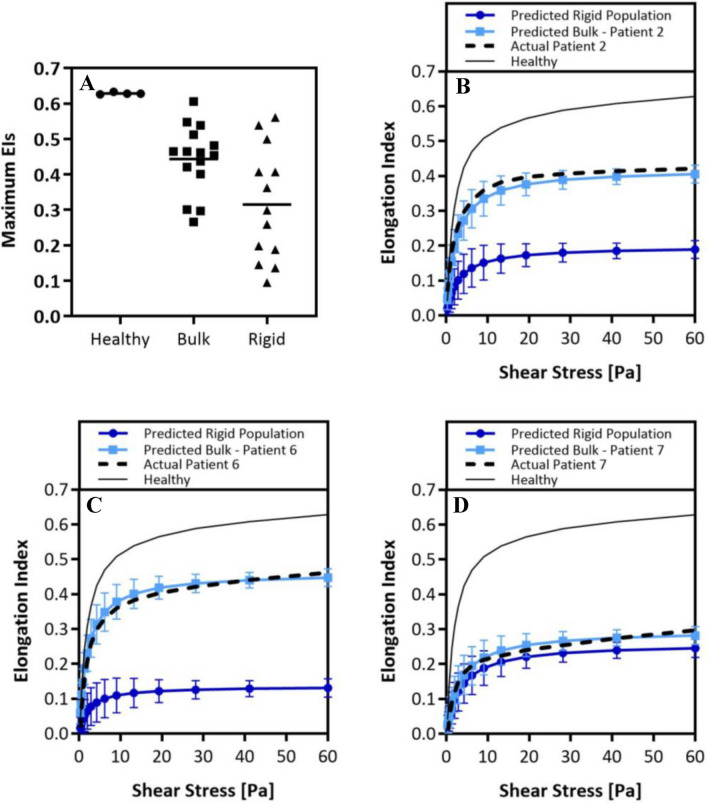
Figure 2.
Predicting the rigidity of the rigid RBC populations in sickle-cell disease patients. (A), Average maximum EIs of healthy donors, actual bulk patient measured maximum EIs, and predicted maximum EIs of rigid population. Actual healthy and patient ektacytometry curves compared with predicted patient bulk ektacytometry curve and predicted curve of the rigid RBC population: (B), patient 2. (C), patient 6. (D), patient 7. Error analysis of the predicted EIs as a function of shear was performed using least square difference analysis. Error bars are plotted as standard deviation of the predicted elongation values. Student’s t-tests are performed to determine significance between Actual Patient curves and Predicted Bulk Curves, no significant difference is found for any patient using an α = 0.05, p-values > 0.05.

