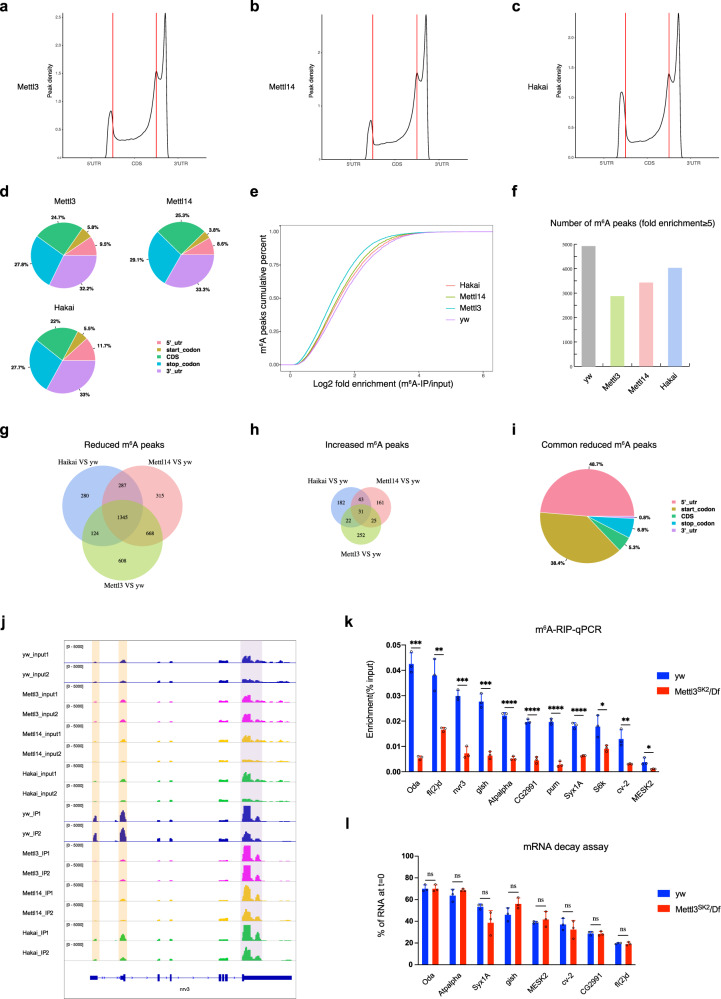
Fig. 7. Effective m6A modification in Drosophila is distributed in 5′UTRs.
a–c MeRIP-seq shows the normalized density of m6A peaks across 5′UTR, CDS, and 3′UTR of mRNA in Mettl3, Mettl14, and Hakai mutant male adult flies. d Pie charts depicting m6A peak distribution in different transcript segments in Mettl3, Mettl14, and Hakai flies. e Cumulative percent distribution of log2 fold enrichment (m6A-IP/input) in yw, Mettl3, Mettl14, and Hakai flies. f When filtered with fold enrichment ≥5, the number of m6A peaks dropped in Mettl3, Mettl14, or Hakai mutant compared with yw. g Venn diagram showing the overlap of reduced m6A peaks (P < 0.05 and fold change ≤0.5) between Mettl3, Mettl14, and Hakai flies versus yw control. h Venn diagram showing the overlap of increased m6A peaks (P < 0.05 and fold change ≥2) between Mettl3, Mettl14, and Hakai flies versus yw control. i Pie chart depicting the distribution of 1345 common reduced m6A peaks in different transcript segments. j IGV tracks displaying MeRIP-seq (lower panels, IP) and RNA-seq (upper panels, input) reads along nrv3 mRNA in yw, Mettl3, Mettl14, and Hakai male flies. Note the reduced peaks in the 5′UTR (shaded in yellow) and peaks in the 3′UTR (shaded in purple) are not changed. k m6A-IP-qPCR validation for selected mRNAs in yw or Mettl3SK2/Df male flies. l The m6A-containing mRNAs were measured by qPCR in yw or Mettl3SK2/Df imaginal discs, at time = 0 or after four hours actinomycin D treatment to block transcription. k, l Data are presented as mean ± SD from three biological replicates. *P < 0.05; **P < 0.01; ***P < 0.001; ****P < 0.0001; ns not significant, two-sided unpaired t test. In k, P = 0.0001, 0.0043, 0.0003, 0.0003, <0.0001, <0.0001, <0.0001, <0.0001, =0.0273, 0.0073, 0.0276 for Oda, fl(2)d, nvr3, gish, Atpalpha, CG2991, pum, Syx1A, S6k, cv-2, MESK2. In l, P > 0.9999, =0.2282, 0.0832, 0.0939, 0.5032, 0.455, 0.8416, 0.7415 for Oda, Atpalpha, Syx1A, gish, MESK2, cv-2, CG2991, fl(2)d. Source data are provided as a Source Data file.

