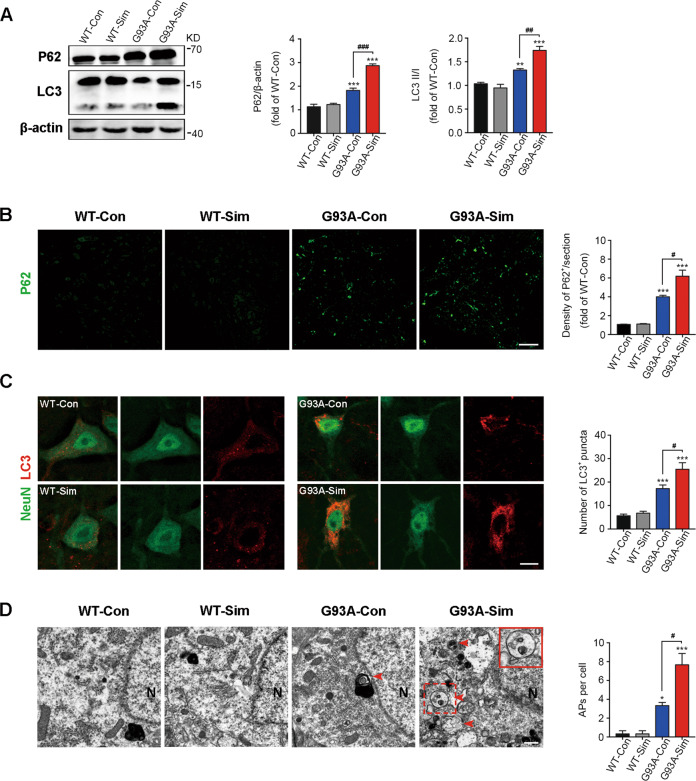
Fig. 1. Simvastatin aggravated impairment of autophagic flux in SOD1G93A mice.
A Western blot analysis of P62 and LC3 in the lumbar spinal cords of WT and SOD1G93A mice treated with or without simvastatin at 120 days. Quantification of P62 and LC3 levels from immunoblots normalized to the WT-Con group. B Immunofluorescence labeling of P62 (green) in the lumbar spinal cord at 120 days (Scale bar, 100 μm). Quantification of the average density of P62-positive cells per section. C Immunofluorescence labeling of LC3 (red) in NeuN-positive motoneurons (green) at 120 days (Scale bars, 10 μm). Quantitative analysis of LC3 puncta. D TEM micrographs showed that APs are present in the cytoplasm of MNs in SOD1G93A mice at 120 days and that these structures are absent or rare in MNs of WT mice (red arrowheads; N, nucleus; scale bar, 1 µm). The upper right image shows magnifications for the red dotted box, as shown in the red solid line box. The histogram shows the quantification of APs per cell. (Data represent the mean ± SEM, n = 5 mice per group; statistical significance was assessed by one-way ANOVA or an unpaired t-test, *P ≤ 0.05, **P ≤ 0.01, ***P ≤ 0.001, #P ≤ 0.05, ##P ≤ 0.01, ###P ≤ 0.001).

