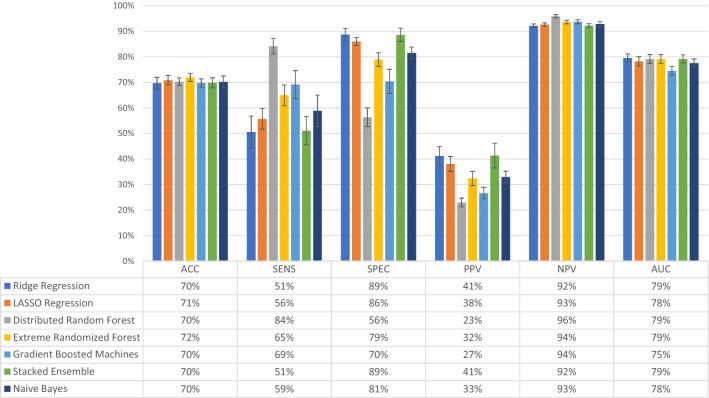
Figure 1.
Evaluation of model performance in the dataset containing only background, medical and pregnancy-related variables (n = 4277 women). The models tested were Ridge Regression, LASSO Regression, Distributed Random Forest, Extremely Randomized Trees, Gradient Boosted Machines, Stacked Ensemble, and Naïve Bayes. Models were assessed for accuracy (ACC), sensitivity (SENS), specificity (SPEC), positive predictive value (PPV), negative predictive value (NPV), and area under the curve (AUC), the outcome being depressive symptoms at 6 weeks postpartum. The bars represent the level of performance measures (in percent) and the table below the bar plot presents the exact numerical values. Error bars represent one standard deviation from the mean.

