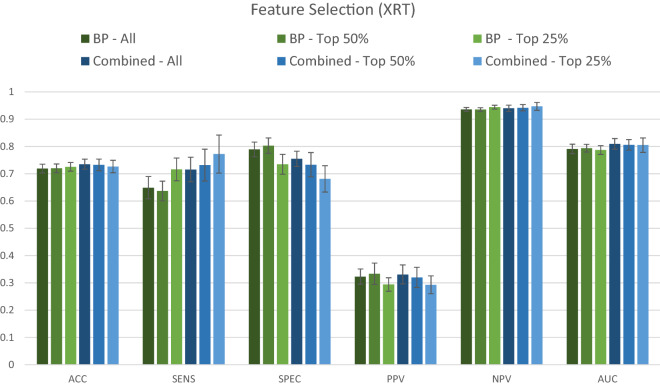
Figure 3.
Comparative performance of the dataset containing only background, medical history and pregnancy-related variables (BP) and the combined dataset (BP + RS + SOC + VPSQ). The Extremely Randomized Trees (XRT) algorithm was used to compare the performance of the two datasets for predicting depression at 6 weeks postpartum. Models were assessed for accuracy (ACC), sensitivity (SENS), specificity (SPEC), positive predictive value (PPV), negative predictive value (NPV), and area under the curve (AUC). The variable selection procedure shows results when All (100%), Top 50%, and Top 25% of variables were retained, ranked according to Mean Decrease in Impurity (MDI) relevance.

