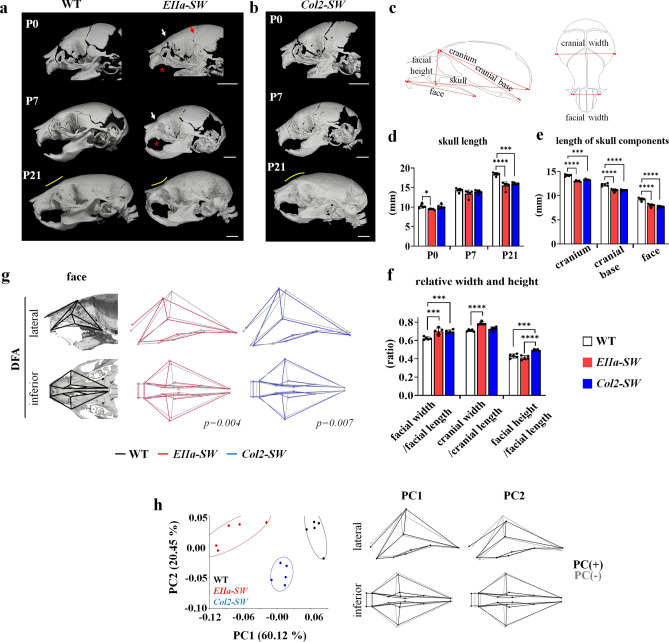
Figure 1.
Chondrocyte-specific Fgfr2S252W mutation shows progressive midface hypoplasia in the absence of premature craniofacial suture closure. (a) Micro-computed tomographic (CT) images of the skulls of the mouse model of Apert syndrome on postnatal days 0, 7, and 21 (P0, P7, and P21). The white and red arrows in the images of EIIa-SW mice indicate the fusion of nasofrontal and coronal sutures, respectively. The red asterisk indicates the fusion of the premaxillo–maxillary suture at P0 and P7. The yellow line indicates the curvature of the nasion. Abbreviations: pm, premaxilla; m, maxilla. Scale bar: 2 mm. (b) Micro-CT images of the skulls of Col2-SW mice at P0, P7, and P21. The yellow line indicates the curvature of the nasion. Scale bar: 2 mm. (c) Schematic of linear measurements of the craniofacial bones. (d) Skull lengths in each group at P0, P7, and P21. (n = 5, each stage) (e) Linear measurements of the cranium, the cranial base, and the face at P21 (n = 5). (f) The facial width and the height, and the cranial width in relation to their length at P21 (n = 5). (g) The facial shapes of the two groups were compared in discriminant function analysis (DFA). The first column indicates the analyzed facial region in the lateral and inferior views. The mean facial shape is displayed by wireframe images. The p values for permutation tests (1000 permutations) between the two groups are listed below of the wireframe images. (n = 5) (h) The variance in the facial shape was analyzed by principal components analysis (PCA). The percentage of total variance for each principal component is displayed on the axis. The shape changes are represented with wireframe images by the axis along the negative principal component axis (gray line) or positive principal component axis (black line) (n = 5). Values are presented as means ± standard deviations. *p ≤ 0.0332, **p ≤ 0.0021, ***p ≤ 0.0002, ****p ≤ 0.0001.

