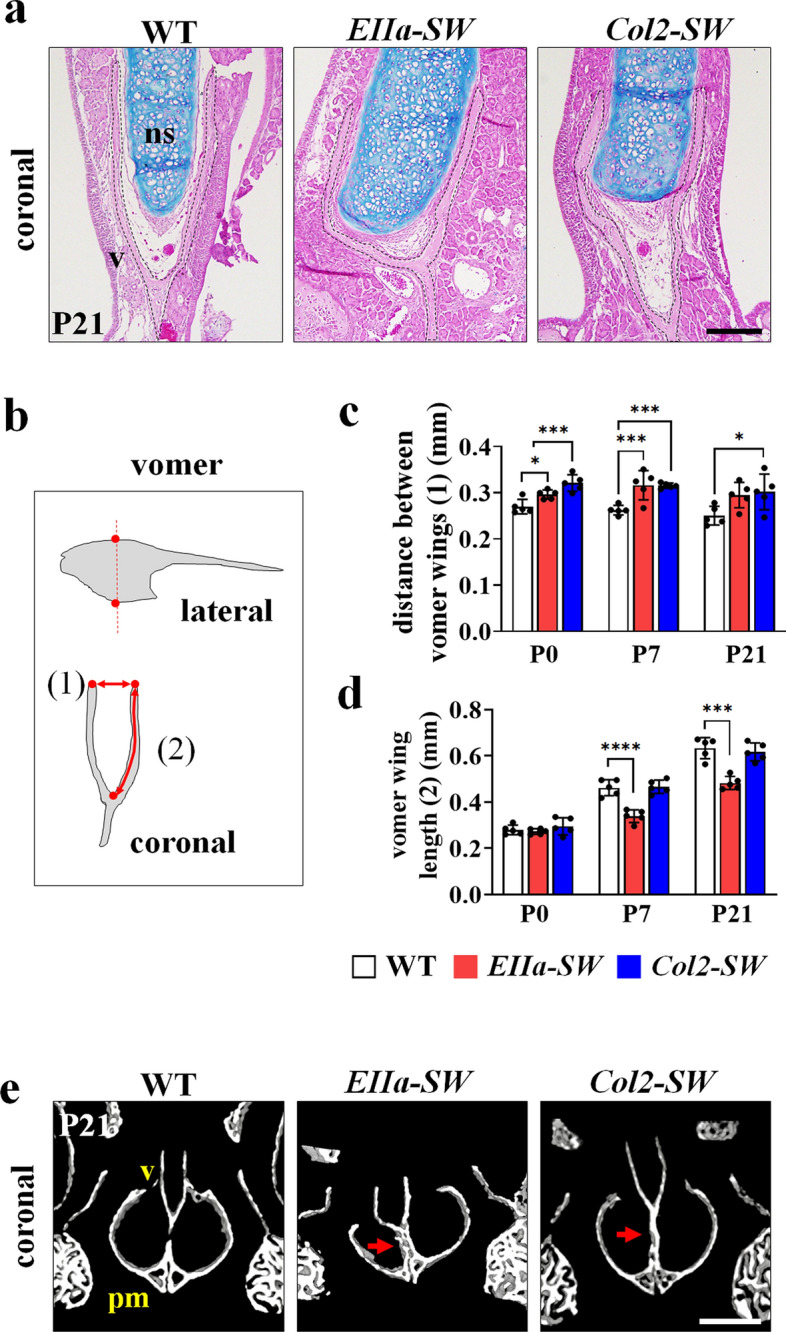
Figure 3.

Thickening of septal cartilage altered the paraseptal structures in mutant mice. (a) Hematoxylin, eosin, and Alcian blue staining of the septal cartilage (ns) and vomer (v) at P21. The dotted line indicates the vomer. Scale bar: 200 µm. (b) Schematic image of the vomer for linear measurements. The measurements were conducted in the coronal plane of 3D reconstructed images, at the highest and the lowest points on the vomer are seen (red dotted line). The distance between the two vomer wings (c) (distance (1) in Fig. 3b) and the length of the vomer wings (d) (length (2) in Fig. 3b) were measured. The lengths of the two wings were averaged (n = 5). (e) Micro-CT images of the vomer and premaxilla bone in the coronal plane. The red arrows indicate the fusion between the vomer (v) and the premaxilla bone (pm). Scale bar: 0.5 mm. Values are presented as means ± standard deviations. *p ≤ 0.0332, **p ≤ 0.0021, ***p ≤ 0.0002, ****p ≤ 0.0001.
