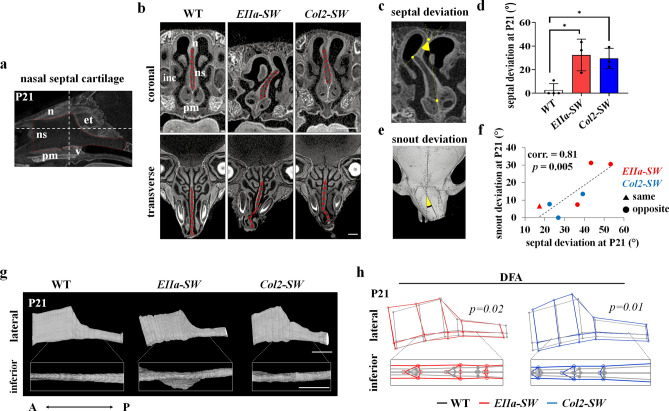
Figure 4.
Thickening and deviation of nasal septal cartilage caused crooked snout in mutant mice. (a) Midsagittal micro-CT image of the nasal cavity of mice at P21, which were stained with potassium triiodide, the contrast agent (Lugol solution), for 48 h. The dotted red line indicates the nasal septum. The white line indicates the coronal and transverse planes for further analyses. Abbreviations: n, nasal bone; ns, nasal septum; pm, premaxilla; v, vomer; et, the perpendicular plate of the ethmoid bone. (b) Coronal view (upper images) and transverse view (lower images) of the nasal cavity. The dotted red line indicates the septal cartilage. Scale bar: 1 mm. (c,d) The measurement of septal deviation in the coronal view of the nasal cavity stained with the contrast agent. The measured plane was matched between groups based on the structural features of incisors, premaxilla, eyeballs and vomeronasal organ. The angle of septal deviation between the most deviated point of the septum and the midline (crossing two points on the nasal bone and the caudal most point of the septum) was measured (n ≥ 3). (e) Measurement of nasal deviation. The angle between the two dotted black lines, parallel to the interfrontal suture and the nasal bone, was measured (n ≥ 3). (f) Correlation between the degree of deviation of the snout and the septum in the mutant mice. The triangle indicates the same deviating direction of the nasal septal cartilage and nose, and the circle indicates the direction opposite of deviation. (g) 3D reconstructed images of the nasal septal cartilage at P21 in lateral and inferior views (magnified in the white box). Scale bar: 1 mm. (h) Mean septal cartilage shape of EIIa-SW and Col2-SW was compared with that of WT mice by DFA with the wireframe images. The inferior view of wireframe image is displayed in the box (n ≥ 3). The p values for 1000 permutation tests between two groups are shown with the wireframe images. Values are presented as means ± standard deviations. *p ≤ 0.0332.

