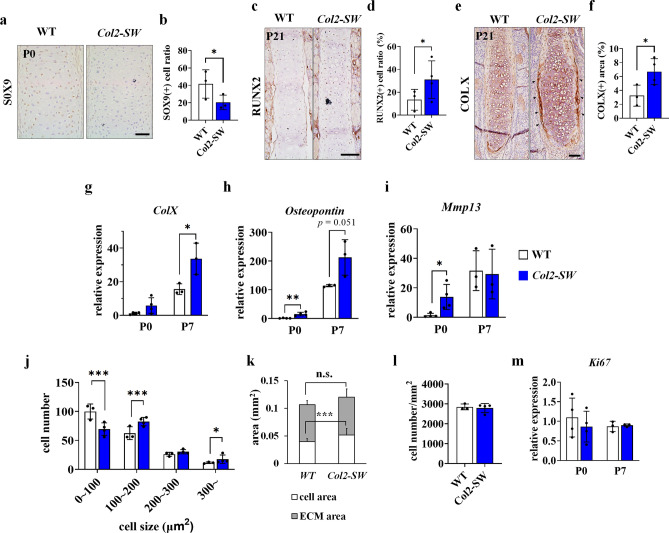
Figure 5.
Increased chondrocyte hypertrophy and cellular size, which induced thickening of the nasal septal cartilage. (a, b) Immunohistochemistry of SOX9 and SOX9-positive cell ratio in the septal cartilage at P0. Scale bar: 50 µm. Three mice per genotype were used. (c,d) Immunohistochemistry of RUNX2 and RUNX2-positive cell ratio in the septal cartilage of mice at P21. Scale bar: 100 µm. (e,f). Immunohistochemistry of type X collagen (COLX) and COLX-positive area ratio in the septal cartilage of mice at P21. Positive cell and area ratio from randomly selected three slides from each mouse was averaged. The black arrowheads indicate the expression of COL X at the edge of the septal cartilage of Col2-SW. Scale bar: 100 µm. For RUNX2 and COLX positive cell or area measurements, three WT mice and four Col2-SW mice were used. Three slides were randomly selected from each mouse. Gene expression of markers of chondrocyte hypertrophy: Col10a1 (g), Osteopontin (h), and matrix metalloproteinase-13 (Mmp13) (i) in the septal cartilage at P0 and P7. The expression level was normalized to Gapdh. RNA from P0 mice (n = 4 per genotype) and P7 mice (n = 3 per genotype) were used. (j) Septal chondrocyte size distribution in the septal cartilage at P21. (k) The extracellular matrix (ECM) (gray) and cellular (white) area in the septal cartilage at P21. The difference of ECM area between two groups was not significant. (l) The cell density (cell number/area) was measured in the septal cartilage at P21. For histological assessments (j–l), three WT mice and four Col2-SW mice were used. Four slides were randomly selected from each mouse. (m) Gene expression of Ki-67 in the septal cartilage at P0 and P7. Values are presented as means ± standard deviations. For Student’s t test, *p ≤ 0.05, **p ≤ 0.01, ***p ≤ 0.001. n.s., not significant.

