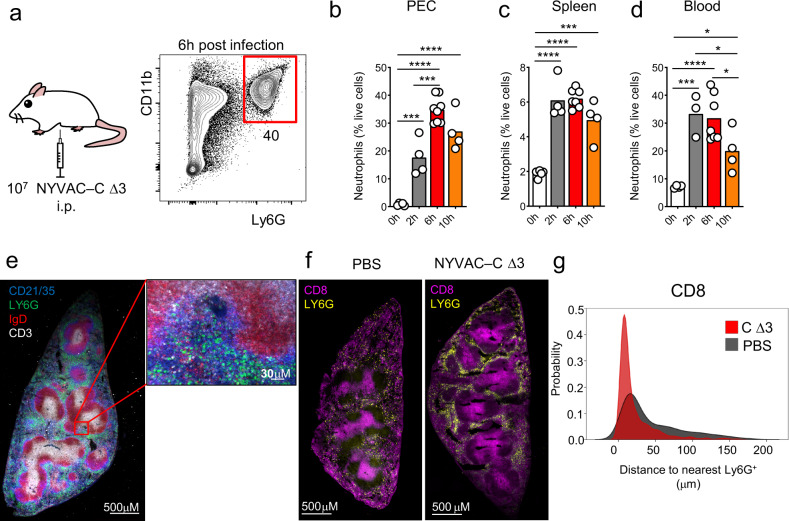
Fig. 1. In vivo time-course of neutrophil accumulation after poxvirus infection.
BALB/c mice were infected by intraperitoneal (i.p.) injection of 107 PFU of NYVAC-C Δ3 virus and Ly6G+ CD11b+ neutrophils were measured at 6 h post infection (a). Percentages of neutrophils in peritoneal cavity (PEC) (b), spleen (c), and blood (d) at 0, 2, 6, and 10 h post infection from NYVAC-C Δ3 injected mice. Spleen tissue section and its magnification from NYVAC-C Δ3-infected mice. Ly6G+ neutrophils in green, CD3+ T cells in white, IgD+ B cells in red, and CD21/35+ cells in blue (e). Spleen tissue section from PBS and NYVAC-C Δ3-injected mice. Ly6G+ neutrophils in yellow, CD8+ T cells in purple (f). Distance of the nearest Ly6G+ cell from CD8+ cells. The nearest neighbor euclidean distance to Ly6G+ is expressed as probability density for each cell belonging to CD8+ clusters (g). Graphs show mean; each point represents an individual mouse. Data are representative of two independent experiments. *P < 0.05, ***P < 0.001, ****P < 0.0001.

