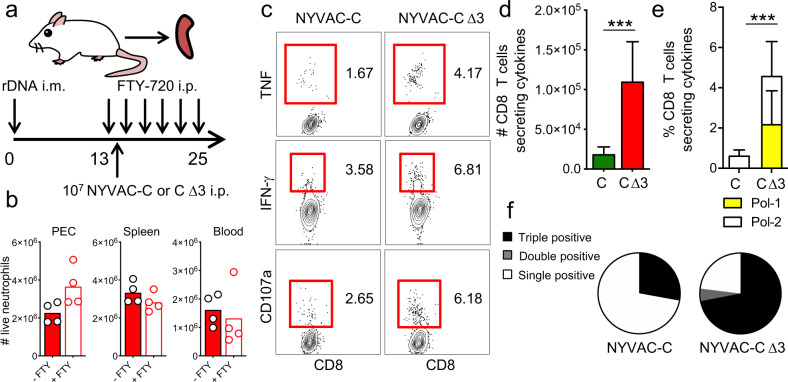
Fig. 2. Splenic HIV-specific T-cell responses is increased after NYVAC-C Δ3 infection.
Vaccine-induced HIV-1-specific CD8 T-cell responses from spleen of mice (n = 4 per group) primed intramuscularly with recombinant DNA, infected with 107 PFUs of NYVAC-C or NYVAC-C Δ3 and injected with FTY720 every other day starting from the day before infection (a). Neutrophil total numbers in peritoneal cavity (PEC), spleen, and blood of NYVAC-C Δ3-injected and FTY720- or PBS-injected mice (b). The response was measured 11 days after the last immunization, after splenocyte stimulation with HIV-1 peptides. Contour plots of CD8 T cells that produce IFN-γ, TNF, and CD107a after NYVAC-C or NYVAC-C Δ3 infection (c). Total numbers (d) or percentages of Pol-1-, Pol-2-specific (e) CD8 T cells that express IFN-γ and/or TNF and/or CD107a. Nonspecific responses of mice infected with control NYVAC-WT were subtracted from the total value. Graphs show mean ± confidence interval (CI). Pie chart colors indicate the relative percentage of cells producing three (black), two (gray), or one (white) activation markers (f). Data are representative of two independent experiments. ***P < 0.001.

