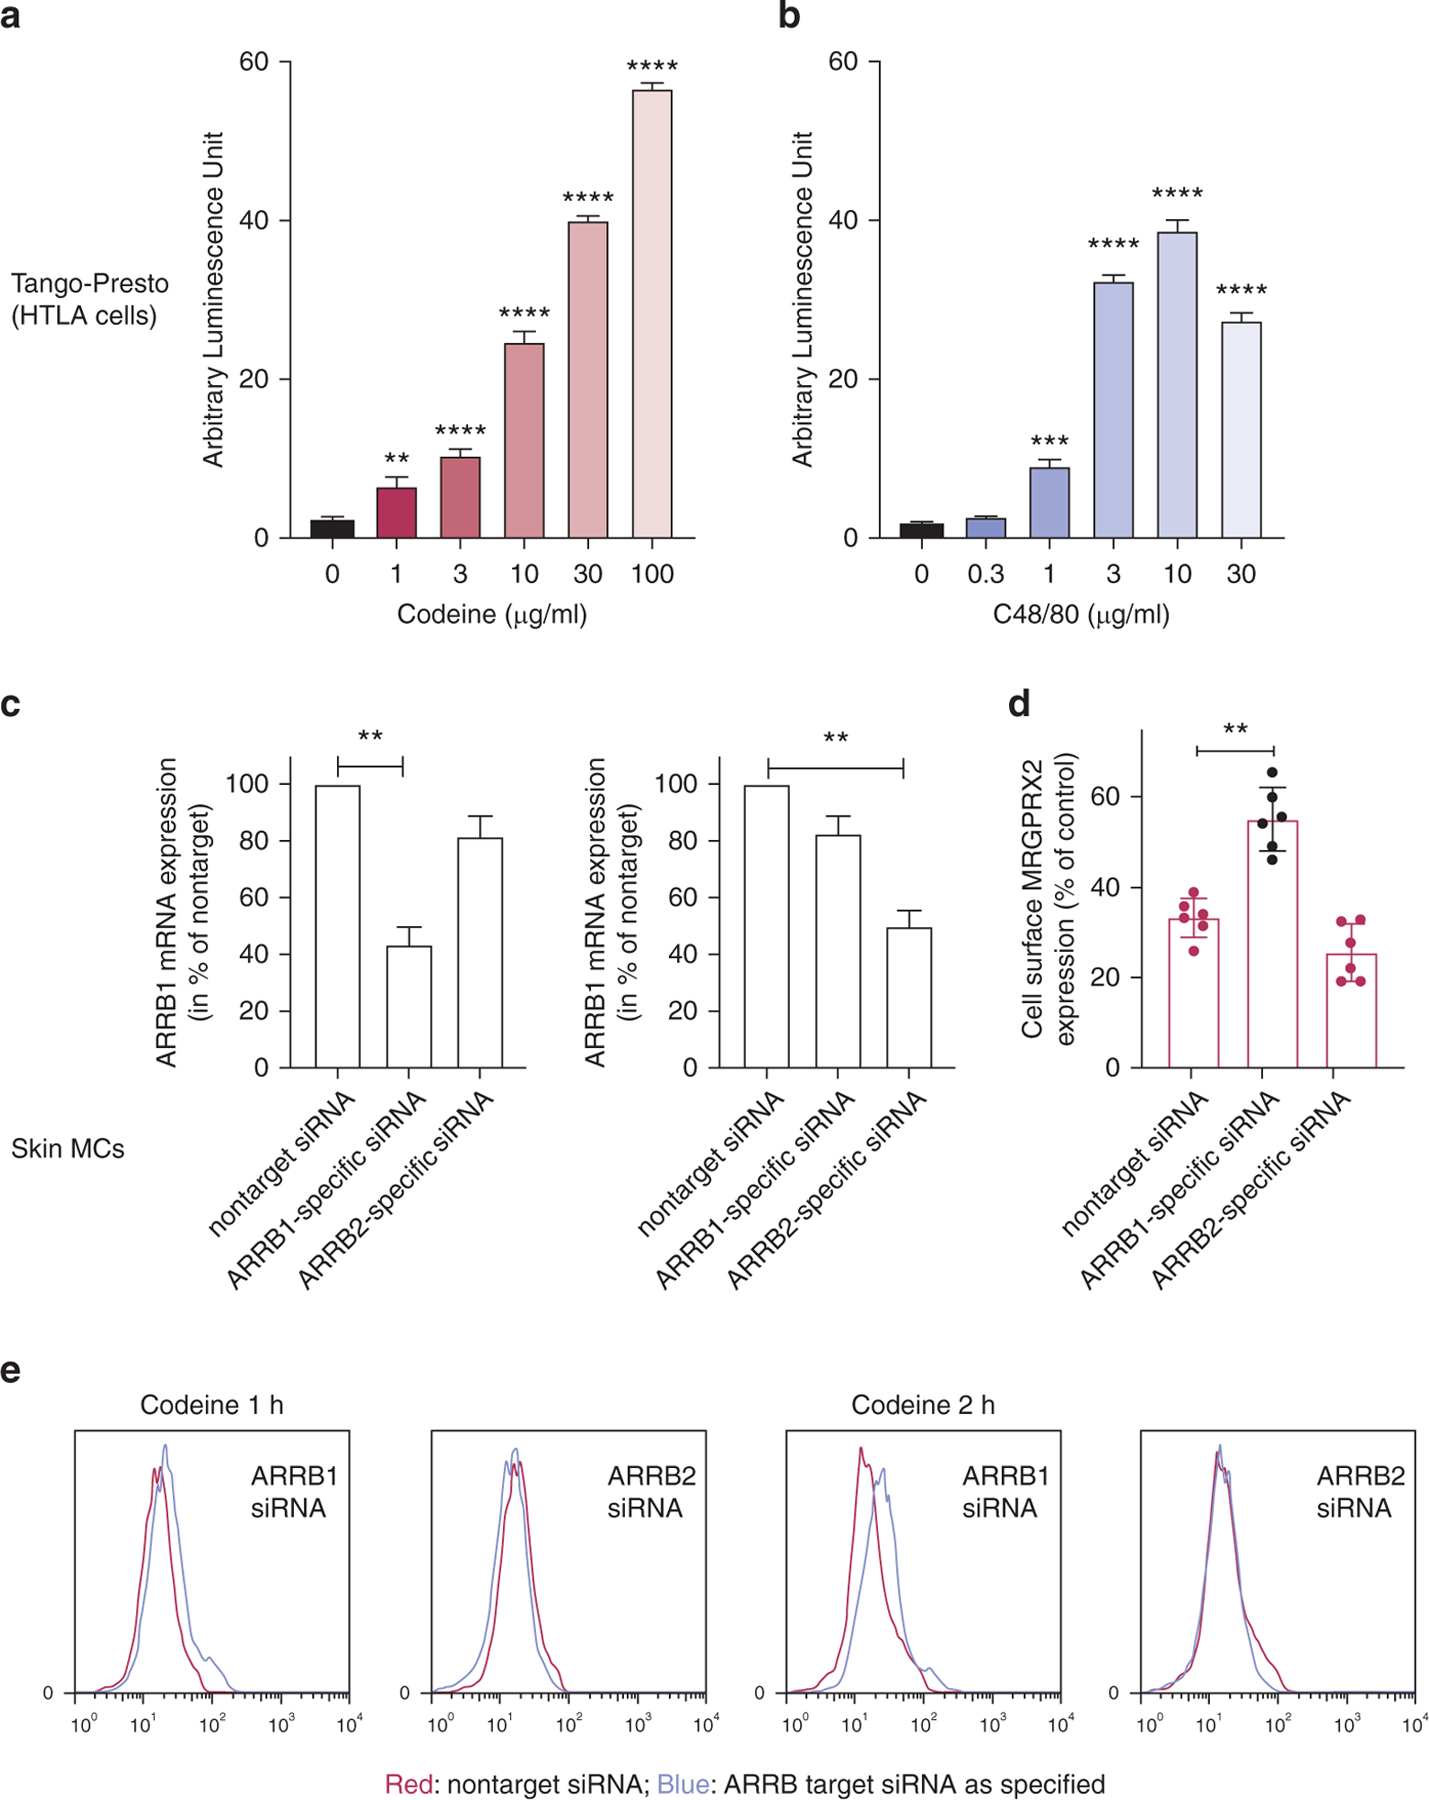
Figure 4. Codeine and C48/80 cause the activation of β-arrestin MRGPRX2 internalization, which depends on β-arrestin-1 in skin MCs.

(a, b) HTLA cells were stimulated overnight with the indicated stimuli, and luminescence units were measured on a luminometer after substrate addition; mean ± SEM and n = 3. (c–e) Skin MCs were treated for 48 hours with ARRB1 selective, ARRB2 selective, or nontarget siRNA. (c) ARRB1 and ARRB2 mRNA expression. (d) MRGPRX2 cell surface expression after codeine (100 µg/ml), normalized to the matching unstimulated control (by net MFI, see Figure 1). Mean ± SEM and n = 6 for c and d. (e) Corresponding representative histograms showing MRGPRX2 expression after codeine triggering in ARRΒ-silenced versus control siRNA-treated cells. Color code is as explained in the figure. **P < 0.01, ***P < 0.001, ****P < 0.0001. C48/80, compound 48/80; h, hour; MC, mast cell; MFI, mean fluorescence intensity; siRNA, small interfering RNA.
