
Figure 7.
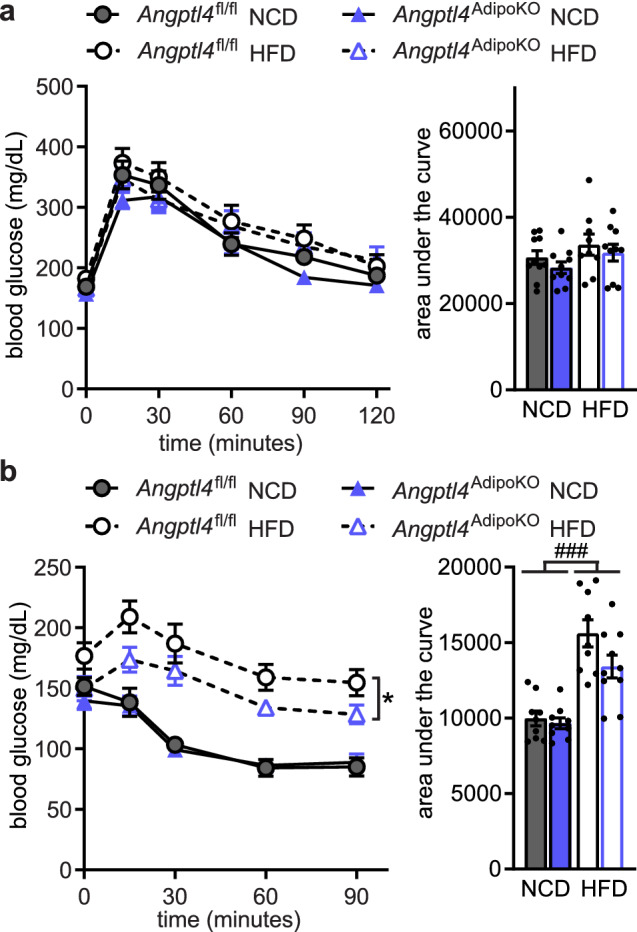
Glucose tolerance and insulin sensitivity of Angptl4AdipoKO mice after chronic high fat feeding. (a) Glucose tolerance tests were performed on fasted (6 h) male Angptl4fl/fl and Angptl4AdipoKO mice after 24 weeks of either a normal chow diet (NCD) or high fat diet (HFD). Blood glucose concentrations were measured over 2 h after injection with glucose. Points represent glucose levels (mean ± SEM; n = 9–10) at each respective time point. Bar graphs represent area under the curve (mean ± SEM) for all time points. (b) Insulin tolerance tests were performed on fasted (4 h) male Angptl4fl/fl and Angptl4AdipoKO mice after 25 weeks of either a normal chow diet (NCD) or high fat diet (HFD). Blood glucose concentrations were measured over 90 min after injection with insulin. Points represent glucose levels (mean ± SEM; n = 9–10) at each respective time point. *p < 0.05 by repeated measures ANOVA. Bar graphs represent area under the curve (mean ± SEM) for all time points. ###p < 0.001 for dietary differences by two-way ANOVA.