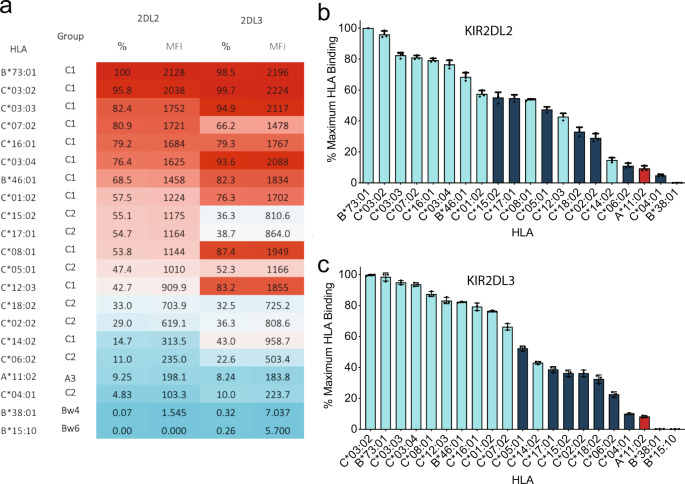
Fig. 4. Single-antigen bead binding of KIR2DL2 and KIR2DL3.
Binding of KIR2DL2 and 2DL3 tetramers to a panel of 97 HLA class I molecules. a Shown as a heatmap by mean fluorescence intensity and percentage of maximum HLA-I ligand binding. b KIR2DL2 and c 2DL3 binding to individual HLA-I beads represented in bar format with errors displayed as standard deviation. HLA are categorised by KIR-binding epitope, HLA-C1 (cyan), HLA-C2 (dark blue), HLA A3/A11 (red). All data are representative of three independent experiments. The top 21 HLA ligands above background are shown. Error bars are shown as mean with SD.

