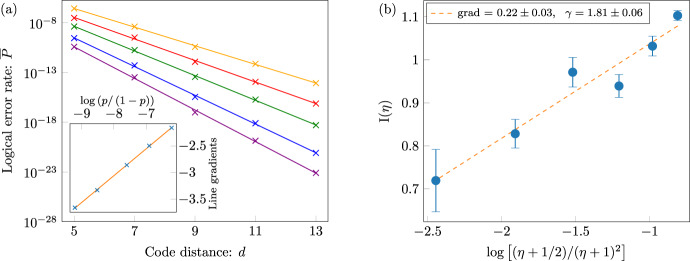
Fig. 10. Analysis of the XZZX code at low error rates.
a Plot showing logical failure rate as a function of code distance d for data where noise bias η = 3. The physical error rates used are, from the bottom to the top curves in the main plot, 0.0001, 0.0002, 0.0005, 0.001 and 0.002. We estimate G(p, η) for each physical error rate p by taking the gradient of each line. Low error rate data are collected using the method proposed in refs. 76,77. The inset plot shows the gradients G(p, η) as function of for η = 3. Values for G(p, η), see Eq. (8), are estimated using the linear fittings. Gradient of line of best fit to these data points is 0.504(4) in agreement with the expected gradient 1/2. b Plot showing intercepts I(η) shown as a function of . The intercept function is defined in Eq. (9) and estimated from the intercept of lines such as that shown in the inset of plot a. Error bars indicate one standard deviation relative to the fitting procedure.

