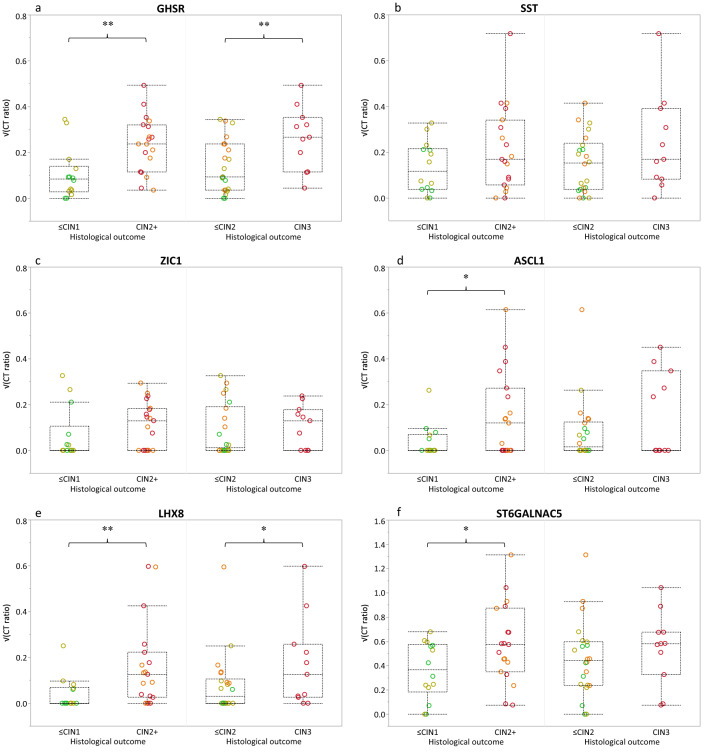
Figure 4.
Difference in methylation ratios (square root transformed; y-axis) for normal/low-grade and high-grade cervical disease according to histological outcome (CIN2 + and CIN3; x-axis); normal/CIN0 (green circles, n = 6), CIN1 (yellow circles, n = 8), CIN2 (orange circles, n = 8), and CIN3 (red circles, n = 11). Box-plots indicate median methylation levels of (a) GHSR, (b) SST, (c) ZIC1, (d) ASCL1, (e) LHX8, and (f) ST6GALNAC5 and according interquartile ranges (25th and 75th percentile). P-values (Mann Whitney U-test) indicated by a double asterisk mean that the null hypothesis (H0) is rejected (p ≤ 0.05) and that the median square root transformed methylation marker ratios between normal/low-grade and high-grade cervical disease are not equal. P-values indicated by a single asterisk indicate a trend (0.05 < p ≤ 0.10).

