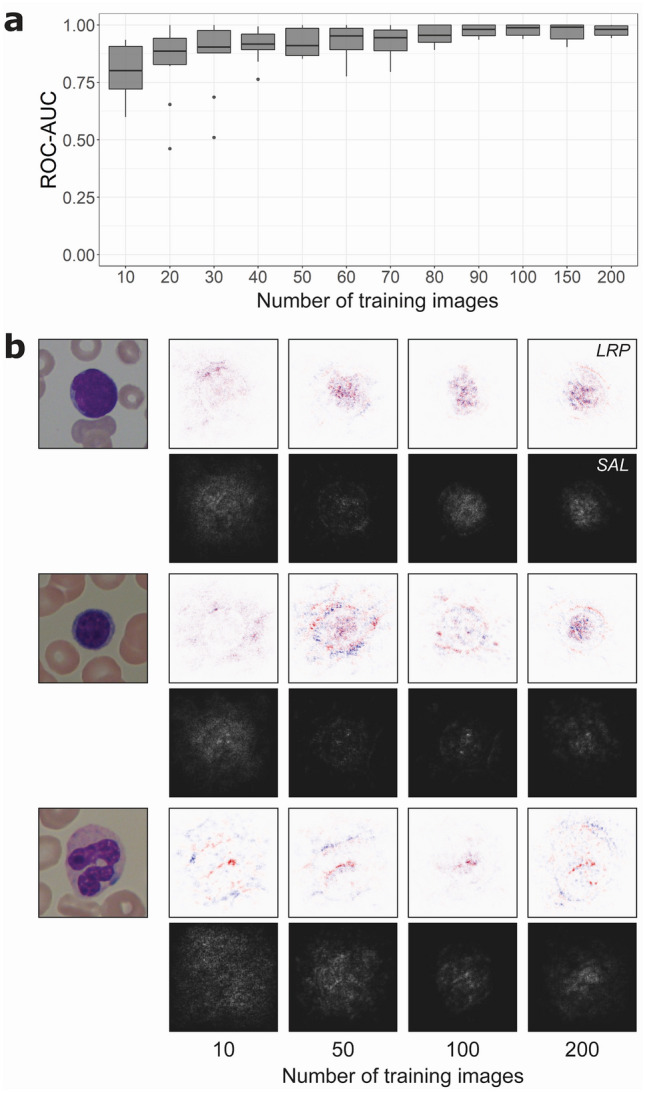
Figure 4.

Lymphoblast classification performance and analysis as a function of training images from the ALL dataset. (a) Starting with ten training images, in each step ten images are added to the training set and the network is trained from scratch. The ROC-AUC of this network is calculated, and the process is repeated ten times so that all 250 images are at some point used as a training and validation set. Boxes show median and 2nd and 3rd quartile, with whiskers indicating the highest and lowest point within 1.5 times the interquartile range. Data points outside this range are considered outliers and visualized separately as dots. (b) Visualization with saliency maps (SAL) and layer-wise relevance propagation (LRP) when testing a lymphoblast (top), typical lymphocyte (middle) and segmented neutrophil (bottom) in networks trained on 10, 50, 100 and 200 images. In LRP, pixels visualized in red contribute positively to the final prediction, while pixels in blue carry negative relevance. In saliency maps, brighter pixels indicate a greater contribution to the final classification. Networks trained on 10 and 50 images seem to focus more on the surroundings of the leukocyte, while the networks trained on more images increasingly focus on the target cell itself and its nuclear structure.
