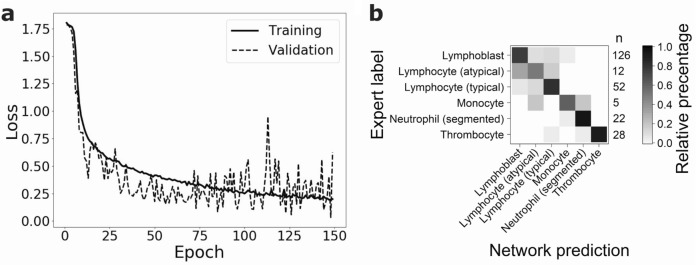
Figure 7.
Multiclass classification of the ALL dataset using 200 training images. (a) Decrease of validation and training loss during training of one of the ten folds. Classification of the test set results in an F1-score of 0.81 ± 0.09 (mean ± s.d., n = 10 folds). (b) Confusion matrix visualizing the percentage of network predictions in each class. On the right hand side of the matrix the number of images in each class is given. In each class, 50% (in the case of atypical lymphocytes) or more cell images are classified correctly. Atypical lymphocytes (n = 12) and monocytes (n = 5) have the lowest number of images and show the most misclassifications.

