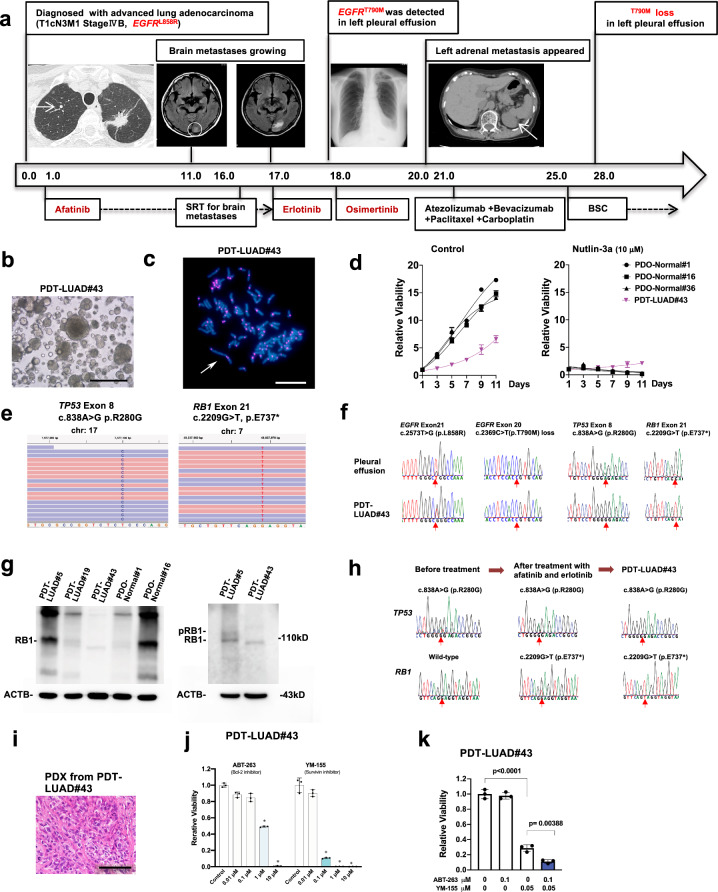
Fig. 3. Patient-derived tumoroids (PDTs) from malignant effusion of lung cancer with acquired resistance to EGFR TKIs (tyrosine kinase inhibitors) (PDT-LUAD#43).
a Timeline of treatment for a patient with EGFR mutations is shown. Numbers represent months since initial diagnosis. b Shown is a bright-field microscopy image of PDT-LUAD#43. Scale bar, 500 μm. c Metaphase FISH image is shown as described in Fig. 1e. Aberrant chromosome indicated by a white arrow was seen. Scale bar, 20 μm. d Cell viability assays were conducted as described in Fig. 1d. e Exome-seq detected c.838A > G (p.R280G) in both alleles of TP53 and c.2209G > T (p.E737*) in both alleles of RB1 from PDT- LUAD#43. Red and blue lines represent forward and reverse reads, respectively. f Sanger sequencing detected monoallelic EGFR c.2573T > G (p.L858R) alteration in addition to the exome-seq data shown in Fig. 3e. EGFR c.2369C > T (p.T790M) mutation was detected before osimertinib treatment but was lost in the effusion and the tumoroid. g Total RB1 was detected using RB1 antibody in all lung tumoroids (PDTs) and normal lung organoids (PDOs) except PDT-LUAD#43 (left panel). A phosphorylated RB1 band in PDT-LUAD#5 but not in PDT-LUAD#43 was observed using a longer running gel (right panel). h Sanger sequencing detected TP53 c.838A > G (p.R280G) mutation in the biopsied specimen before any of the TKI treatment. RB1 c.2209G > T (p.E737*) mutation was not detected before the TKI treatment, however the mutation appeared after afatinib and erlotinib treatment. i Shown is an HE stained image of PDX derived from PDT-LUAD#43. Scale bar, 100 μm. j Bcl-2 inhibitors (ABT-263) and a survivin inhibitor (YM-155) significantly suppressed the growth of PDT-LUAD#43 72 h after treatment. Cell viability assays were performed as described in Fig. 1d. Data are shown as mean ± SD. k Combination treatment of ABT-263 and YM-155 significantly suppressed the viability of PDT-LUAD#43 72 h after treatment. Data are shown as mean ± SD.

