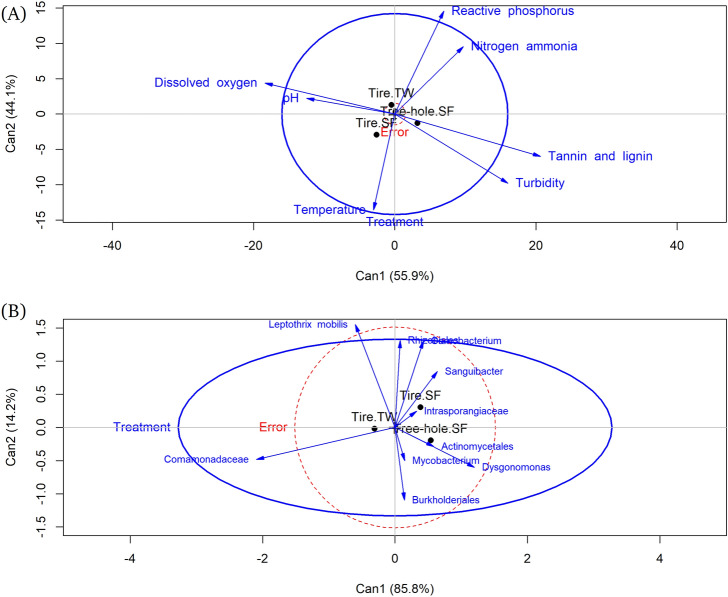
Figure 5.
Canonical discriminant analysis of the correlation between water chemistry parameters and larval environment type (A); and the correlation between dominant bacterial OTUs in the water samples and larval environment type (B). The lines represent the h-plot of important water chemistry parameters, or dominant OTUs, the points represent the means for the larval environment type. The length of the line of the variable in the plot is proportional to its importance in separating the data into the three habitat types.

