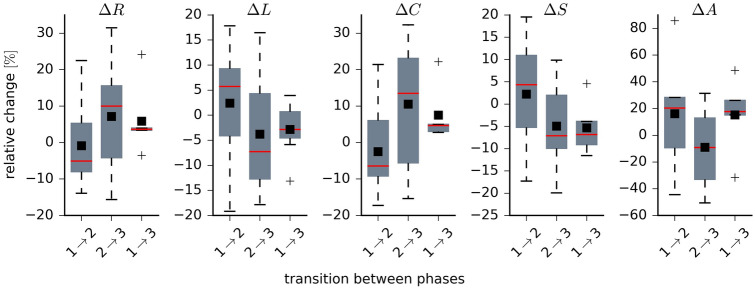
Figure 3.
Distributions of taVNS-related alterations in network characteristics. Boxplots of relative changes in network characteristics. Relative changes calculated as , where and denote placeholders for the temporal means of the respective characteristics from phase k and phase l (global synchronization level R, average shortest path length L, average clustering coefficient C, synchronisability S, and assortativity A). During phase 1, network characteristics attained the following values: , , , , and . Bottom and top of a box are the first and third quartiles, and the red band and the black square are the median and the mean of the distribution. The ends of the whiskers represent the interquartile range of the data. Outliers are marked by a + sign.

