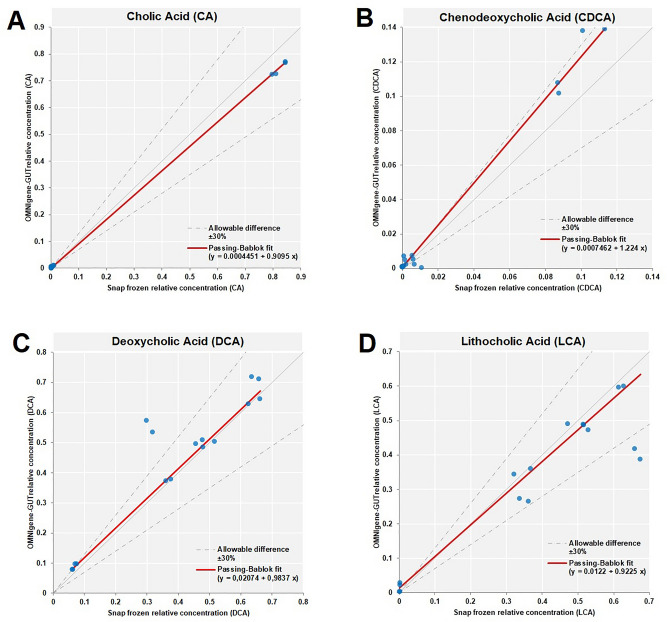
Figure 4.
Passing-Bablok method comparison and correlation analysis for bile acids with average relative concentration higher than 0.01. The relative concentrations of Cholic Acid (A), Chenodeoxycholic Acid (B), Deoxycholic Acid (C) and Lithocholic Acid (D) in OMNIgene-GUT and snap frozen samples are plotted and indicated by the blue points. The snap frozen is taken as the reference method, while the OMNIgene-GUT is taken as the test method. The Passing-Bablok fit is shown as the red line. The allowable bias between the relative concentrations in OMNIgene-GUT and snap frozen samples is 30%.

