
Figure 3.
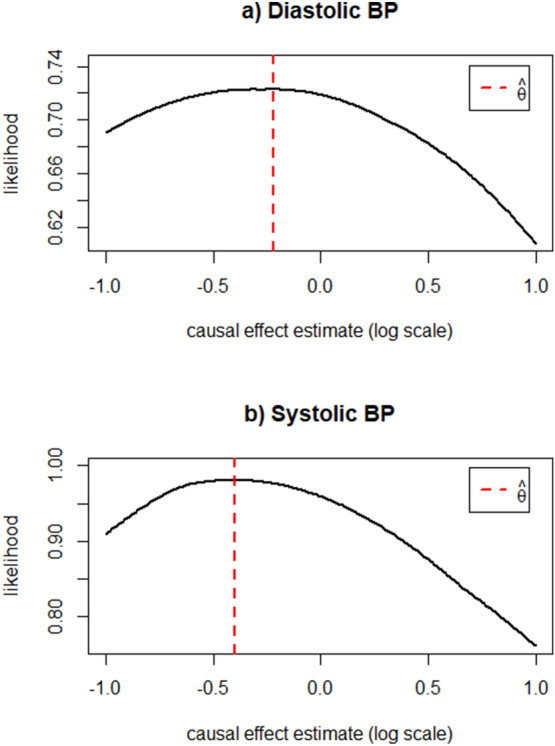
MRMix estimation performance—mixed ethnicity sample. These two plots display the estimated causal effect (theta, ) during maximum likelihood estimation for diastolic and systolic blood pressure by MRMix in the multi-ethnicity sample. A clear, sharp peak indicates stable performance in the estimation of theta. The dotted red lines indicate the ML estimates of theta () reported in the Results section, respectively for each exposure.