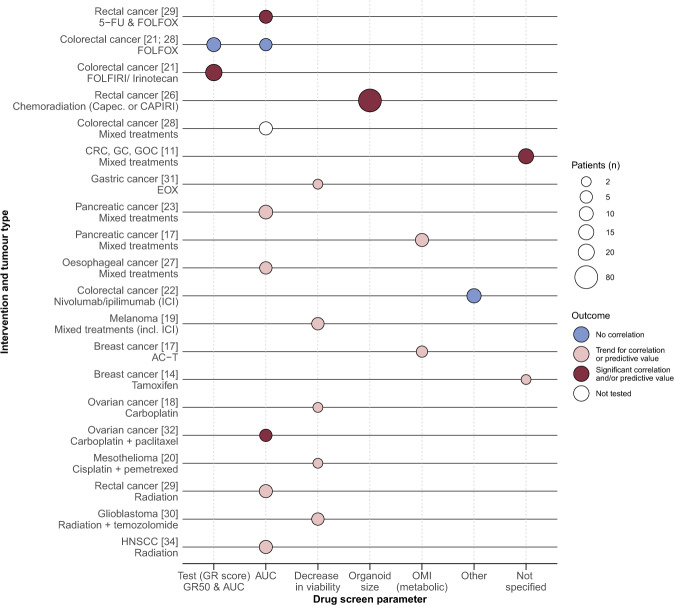
Fig. 2. Evidence landscape of PDO drug screen parameters and clinical response.
Illustrates the clinical validity results for PDOs as a predictive biomarker for treatment response (dark red: significant correlation and/or predictive value found, pink: trend for correlation or predictive value found, blue: no correlation and white: not tested), with the size of the circle representing the patient cohort size, specified per treatment and tumour type (y-axis) and ex vivo drug response parameter (x-axis). Abbreviations: 5-FU 5-fluorouracil, AC-T doxorubicin + cyclophosphamide + paclitaxel, AUC area under the curve, Capec. capecitabine, CAPIRI capecitabine + irinotecan, CRC colorectal cancer, EOX epirubicin + oxaliplatin + 5-FU, FOLFIRI 5-FU + irinotecan, FOLFOX 5-FU + oxaliplatin, GC gastric cancer, GOC gastroesophageal cancer, GR growth rate inhibition metrics, GR50 value with 50% viable GR, HNSCC head and neck squamous cell carcinoma, ICI immune checkpoint inhibitors, OMI optical metabolic imaging, PDO patient-derived organoid.

