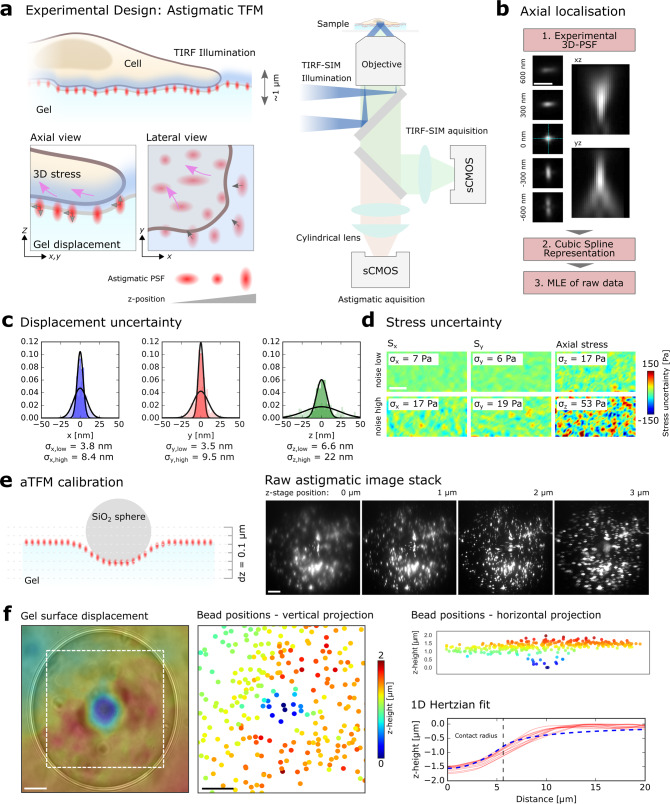
Fig. 1. Overview of the uncertainty estimation and calibration of aTFM.
a Schematic outlining the aTFM method. TIRF illumination at the top surface of the gel excites both cellular structures and fluorescent marker beads. The TIRF-SIM optical path with two sCMOS cameras in combination with the cylindrical lens permits TIRF-SIM imaging of cellular structures while astigmatic imaging of the marker beads allows extraction of axial positional information. b Outline of the bead localisation procedure in aTFM. First, the 3D-PSF (point spread function) of the microscope is acquired and modelled using cubic splines. The cylindrical lens in the emission light path introduces an astigmatic modulation of the microscope PSF allowing the orthogonal widths to report on bead position relative to the focal plane. Scale bar is 1 µm. This experimentally acquired PSF model is then compared to the raw bead images and the z-position is established via a maximum likelihood estimation (MLE). c Estimation of the displacement uncertainty resulting from an MLE of the astigmatic PSF. Plots show the lateral displacements uncertainty (blue and red histograms) as well as the axial displacement uncertainty (green histogram). The displacement uncertainty is calculated for the case of no cellular fluorescent background (low noise) and the case where there is bleed-through of fluorescent signal from the cell (high noise). d Estimation of the corresponding uncertainty in the lateral (Sx,Sy) and axial (Sz) stresses for a 10 kPa gel for the case of high and low image noise level. Scale bar is 5 µm. e Left: schematic outlining the aTFM calibration using a 70 µm diameter SiO2 sphere applying a known force of 3 nN to the upper gel surface. Right: corresponding stack of astigmatic images for different axial locations displaying the degree of PSF aberration resulting from the applied force. Scale bar is 10 µm. f Left: Interpolated axial position of the top surface of the gel underlying the SiO2 sphere calculated by estimating the position each bead within the FOV. Scale bar is 10 µm. Right: Axially colour coded bead positions within the FOV. Left-bottom: The 1D Hertzian model (dashed blue line) applied to the contact profile (red lines) of the SiO2 sphere, allowing the applied force to be estimated.

