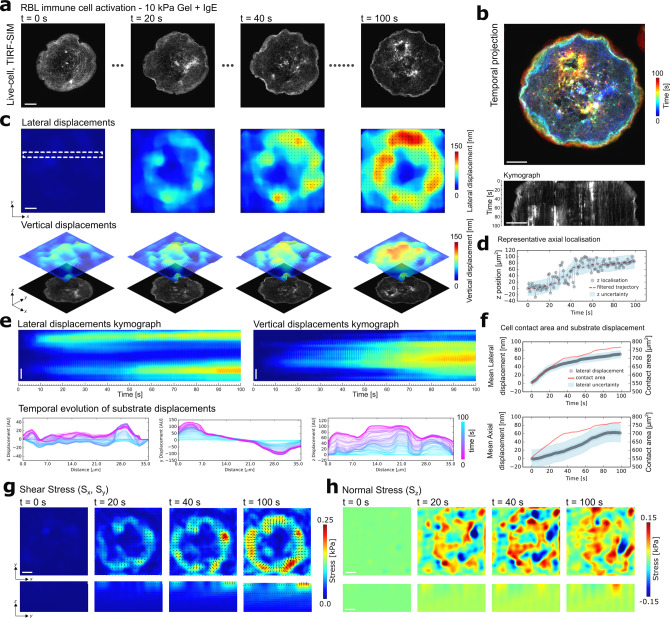
Fig. 3. Quantifying out-of-plane force generation during RBL immune cell activation using aTFM.
a TIRF-SIM snap shots of an activating RBL cell over the course of the 100 s, 100 frame movie. Scale bar is 5 µm. b Upper: Temporal projection of RBL cell during activation. Lower: Kymograph indicating the increase in contact area during RBL cell activation. Scale bar is 5 µm. c Upper: Snap shots of the magnitude of lateral displacements resulting from RBL cell activation. Lower: Surface plots of the corresponding vertical displacement of the gel. The cell image is displayed below to facilitate correspondence of displacements with cellular structures. Scale bar is 5 µm. d Plot showing the axial position of a representative raw bead trajectory (grey dots), as well as the filtered position (red) and displacement uncertainty as derived in Fig. 1c (blue region). e Both kymographs and line plots showing the continuous temporal evolution of the lateral and vertical surface displacements over the course of the recording. Scale bar is 5 µm. f Plot showing the mean lateral and vertical gel displacements (grey dots) underlying the cell as a function of time during activation overlays with a quantification of cell contact area (red). The corresponding displacement uncertainty as derived in Fig. 1c is shown in blue. g Upper: Snap shots of the magnitude of shear stress resulting from RBL cell activation. Lower: Cross-section of the gel showing the distribution of shear stress through the bulk of the gel. Scale bar is 5 µm. h Upper: Snap shots of the magnitude of normal stress at the gel surface. Lower: Cross-section of the gel showing the distribution of normal stress through the bulk of the gel. Scale bar is 5 µm.

