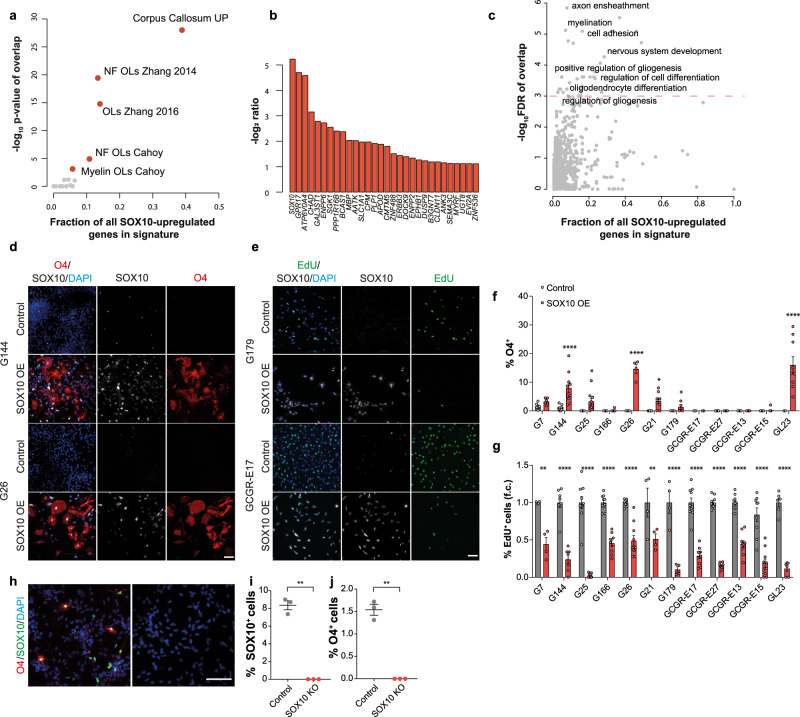
Fig. 5. SOX10 overexpression induces pre-oligodendrocyte differentiation.
a Enrichment of genes upregulated by SOX10 in vitro for signatures of glial and neuronal lineages (Supplementary data 4 and 5) and genes up-regulated in G144 xenografts upon invasion into the Corpus callosum (Corpus callosum UP). -log10 transformed p-values of one-sided Fisher tests plotted as a function of the percentage of all SOX10 regulated genes in each list. b most up-regulated genes upon SOX10 induction in vitro (top 20). DEseq2 log2 ratio of Doxycyclin- versus vehicle-treated cells are plotted. c GO enrichment analysis of the genes positively regulated by SOX10 in vitro (Supplementary data 4). GO terms belonging to the Biological process ontology are shown and selected terms are highlighted. -log10 transformed FDR q-values of overlaps are plotted as a function of the percentage of all SOX10 regulated genes present in each list. d O4 (red), SOX10 (grey) and DAPI (blue) staining of indicated GSC lines transduced with empty (Control) or constitutive SOX10-encoding lentiviral vectors. Scale = 100 µm. e representative images of indicated lines transduced with control or SOX10 lentivirus (SOX10 OE) and stained for EdU (green), SOX10 (grey) and DAPI (blue). Scale = 100 µm. f quantifications of % O4+ pre-oligodendrocyte cells in cultures shown in d. ≥200 cells across duplicate coverslips per biological repeat. Mean ± SEM, n = 3 independent transductions. G144 p < 0.0001, G25 p = 0.02, G26 p < 0.0001, G21 p = 0.04, GL23 p < 0.0001. Two-way ANOVA with Sidak’s multiple comparisons test. g quantifications of percentage of proliferating (EdU+) cells in the same cultures as in e. ≥200 cells across duplicate coverslips counted per biological repeat. Mean ± SEM, n = 3 independent transductions, G7 p < 0.0001, G144 p < 0.0001, G25 p < 0.0001, G166 p < 0.0001, G26 p < 0.0001, G21 p = 0.0004, G179 p < 0.0001, GCGR-E17 p < 0.0001, GCGR-E27 p < 0.0001, GCGR-E13 p < 0.0001, GCGR-E15 p < 0.0001, GL23 p < 0.0001. Two-way ANOVA with Sidak’s multiple comparisons test. h representative immunofluorescence images of Control and SOX10 knock-out (SOX10 KO) G144 cultures differentiated for 14 days by growth factor withdrawal and stained for SOX10 (green) and O4 (red). Scale = 100 µm. i, j quantifications of the cultures in h. ≥250 cells across duplicate coverslips per biological repeat. Mean±SEM, n = 3 independent cultures, i p < 0.0001, j p = 0.0002. unpaired two-tailed Student’s t test.

