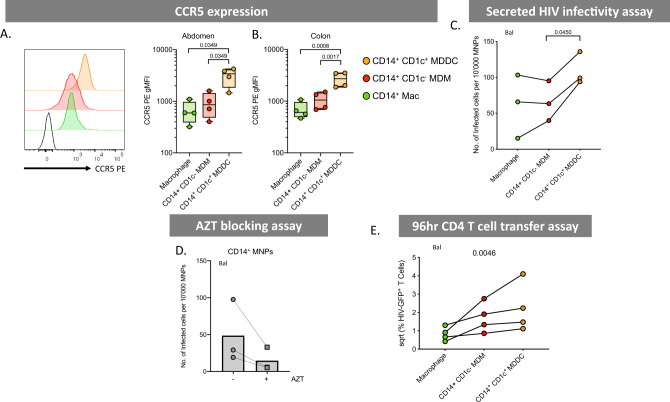
Fig. 7. HIV infectability and transfer capacity of CD14-expressing dermal mononuclear phagocytes.
A CCR5 expression was determined on CD14-expressing MNPs liberated from collagenase type IV digested tissue. Left: histogram representing one abdominal skin donor with black, unfilled histogram representing FMO control. Right: geometric mean fluorescent intensity (gMFI) minus FMO control plotted from abdominal skin (n = 4), plotted as box and whisker plots, box representing the upper and lower quartile, central line representing the median, the whiskers the minimum and maximum of each cell subset and each donor represented by an individual dot. Statistics were generated using a RM one-way ANOVA with Holm–Sidak’s multiple comparisons with adjusted P values shown. B CCR5 expression was investigated in colon (n = 4) plotted as box and whisker plots, box representing the upper and lower quartile, central line representing the median, the whiskers the minimum and maximum of each cell subset and each donor represented by an individual dot. Statistics were generated as in A. C CD14-expressing MNP subsets were FACS isolated and incubated with HIVbal for 2 h before being thoroughly washed off. Cells were then cultured for an additional 96 h in human skin fibroblast conditioned media. Cell supernatants were taken and assessed for secreted HIV using a TZMBL infection assay, with the number of infected cells per 10,000 MNPs calculated and graphed. Individual dots represent three donors matched by connecting lines. Statistics were generated as in A. D Combined CD14-expressing MNPs were sorted and pre-treated for 1 h with 50 µM azidothymidine (AZT) before 2 h culture with HIVBal. Cells were washed three times and incubated for a further 48 h with AZT and then washed three more times. Cells were cultured for another 48 h before cell supernatants were collected and secreted HIV was assessed using a TZMBL infection assay. Each donor represented by individual point matched with joining lines, circles represent untreated cells and squares represent AZT treated cells, column representing the mean. E JLTRs were added to cell cultures from C after supernatants removed, at a ratio of 4:1 and cultured for a further 96 h. Transfer of HIV to T cells was determined using flow cytometry to assess the percent of GFP+ JLTRs. Raw data was square root normalised and plotted, with each dot representing four individual donors with connecting lines matching donors. Statistics were generated using a Friedman test. Macrophages (green), CD14+ CD1c− MDM (red) and CD14+ CD1c+ (orange).

