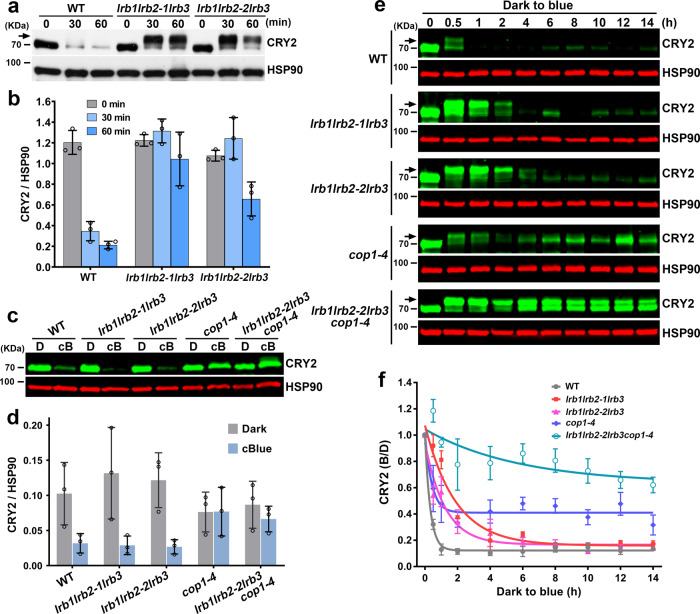
Fig. 2. LRBs and COP1 regulate the rapid or prolonged proteolysis of CRY2, respectively.
a Representative immunoblots showing the abundance of endogenous CRY2 in the 7-day-old etiolated wild type (WT) and lrb123 mutants irradiated with 30 μmol m−2 s−1 of blue light for the indicated time. b Quantitative analysis of CRY2 abundance from immunoblots shown in (a). Data are presented as mean ± SD (n = 3 individual immunoblots). c Representative immunoblots showing the abundance of endogenous CRY2 in seedlings of indicated genotypes grown in darkness (D) or continuous blue light (cB, 30 μmol m−2 s−1). d Quantitative analysis of CRY2 abundance from immunoblots shown in (c). Data are presented as mean ± SD (n = 3 individual immunoblots). e Representative immunoblots showing degradation of the endogenous CRY2 in 7-day-old etiolated seedlings irradiated with 30 μmol m−2 s−1 of blue light for indicated time. f Quantitative analysis of CRY2 degradation from immunoblots shown in (e). Data are presented as mean ± SD (n = 3 individual immunoblots). CRY2 (B/D) = [CRY2/HSP90]blue / [CRY2/HSP90]dark. The best fitted curves with one phase decay of nonlinear regression were shown. CRY2 and HSP90 were detected with anti-CRY2 antibody and anti-HSP90 antibody, respectively. HSP90 is used as a loading control. Arrows indicate phosphorylated CRY2. The above experiments were repeated at least three times with similar results.

