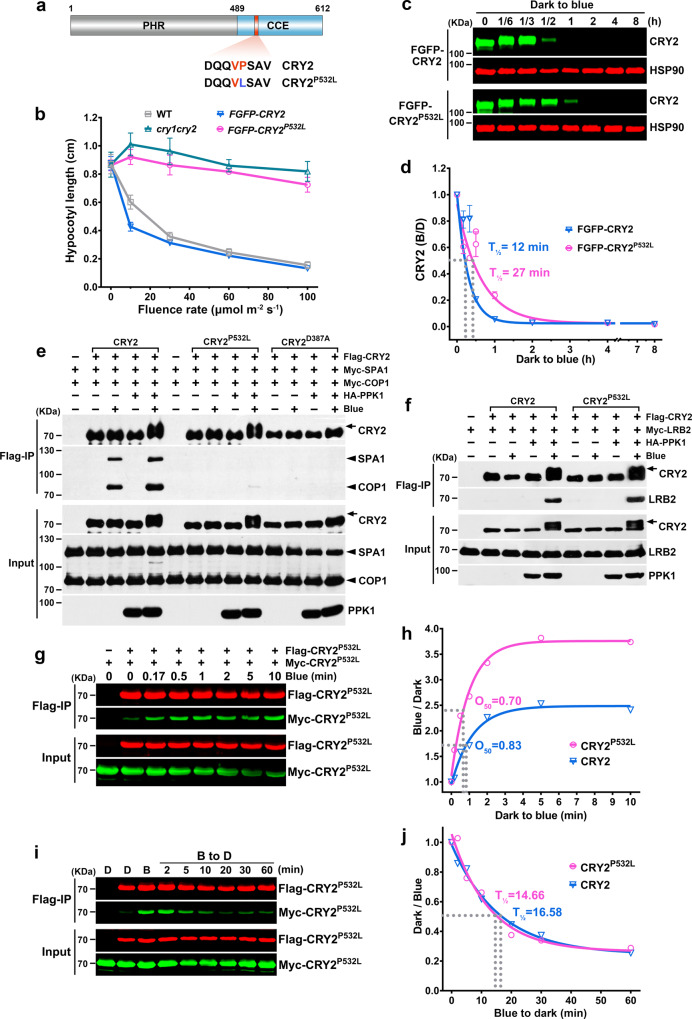
Fig. 6. LRBs and COP1 interact with different structural elements of CRY2.
a A schematic diagram depicting the CRY2P532L mutation. PHR, photolyase homologous region; CCE, CRY C-terminal extension; DQQVPSAV, VP motif in CRY2; numbers, amino acid positions. b Hypocotyl length of 6-day-old seedlings of indicated genotypes grown under blue light of different light intensities. Data were shown as mean ± SD. c Immunoblots showing degradation of FGFP-CRY2 or FGFP-CRY2P532L in 7-day-old etiolated seedlings irradiated with blue light (100 μmol m−2 s−1) for the indicated time. Immunoblots were probed with anti-CRY2 and anti-HSP90 antibodies. d Quantitative analysis of CRY2 degradation from immunoblots shown in (c), n = 3 individual immunoblots. The best fitted curves with one phase decay of nonlinear regression were shown. CRY2 (B/D) = [CRY2/HSP90]blue / [CRY2/HSP90]dark. T1/2 indicates the time required for 50% degradation. e–f Co-IP assays showing the lack of CRY2P532L/COP1 interaction (e) and the blue light- and phosphorylation-dependent CRY2P532L/LRB2 interaction (f) in HEK293T cells. Transfected cells were either kept in the dark (− Blue) or treated with 100 μmol m−2 s−1 blue light for 2 h (+ Blue). CRY2D387A is used as a negative control. Anti-Flag, anti-Myc or anti-HA antibodies were used for detecting indicated tagged proteins. Arrows indicate phosphorylated CRY2. g Co-IP results showing the photooligomerization of CRY2P532L in HEK293T cells. Transfected cells were irradiated with blue light (30 μmol m−2 s−1) for indicated time. CRY2P532L tagged with Flag or Myc were detected with anti-Flag and anti-Myc antibodies, respectively. h Comparison of photooligomerization kinetics of CRY2 and CRY2P532L in HEK293T cells. Co-IP (α-Myc) signals was normalized to the corresponding IP (α-Flag) signals, and the dark oligomerization level was set as 1. O50 indicates the time required to reach 50% saturation of CRY2 photooligomerization. The best fitted curves with one phase association of nonlinear regression were shown. i Co-IP results showing the dark reversion of CRY2P532L photooligomers in HEK293T cells. The cells were treated with 30 μmol m−2s−1 blue light for 5 min then moved to the darkness for indicated time. j Comparison of the dark reversion dynamics of CRY2 and CRY2P532L photooligomers in HEK293T cells. Similar analyses were performed as in (h), except that the oligomerization level in blue was set as 1. T1/2 indicates the time required to reverse 50% of CRY2 photooligomers into monomers. The best fitted curves analyzed with one phase decay of nonlinear regression were shown. CRY2 photooligomerization and dark reversion data shown in (h) and (j) were extracted from the published paper15 with permission. The above experiments were repeated at least twice with similar results.

