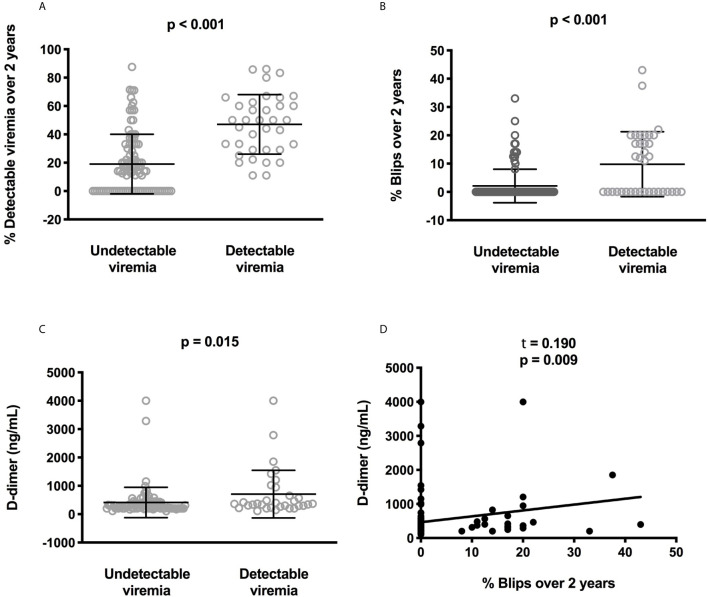
Figure 1.
Correlations between low-level viremia, blips, and D-dimer plasma levels. Difference for each participant in the frequency where the participant displayed low-level viremia (A) or blips (B) over the two last years between participants with or without current detectable viremia. Difference in circulating D-dimer concentrations between participants with or without current detectable viremia. Statistical analyses were performed using a Mann-Whitney test (C). Correlation between the frequency of blips over the two last years and D-dimer plasma levels. Statistical analysis was performed using Kendall correlation (D).

