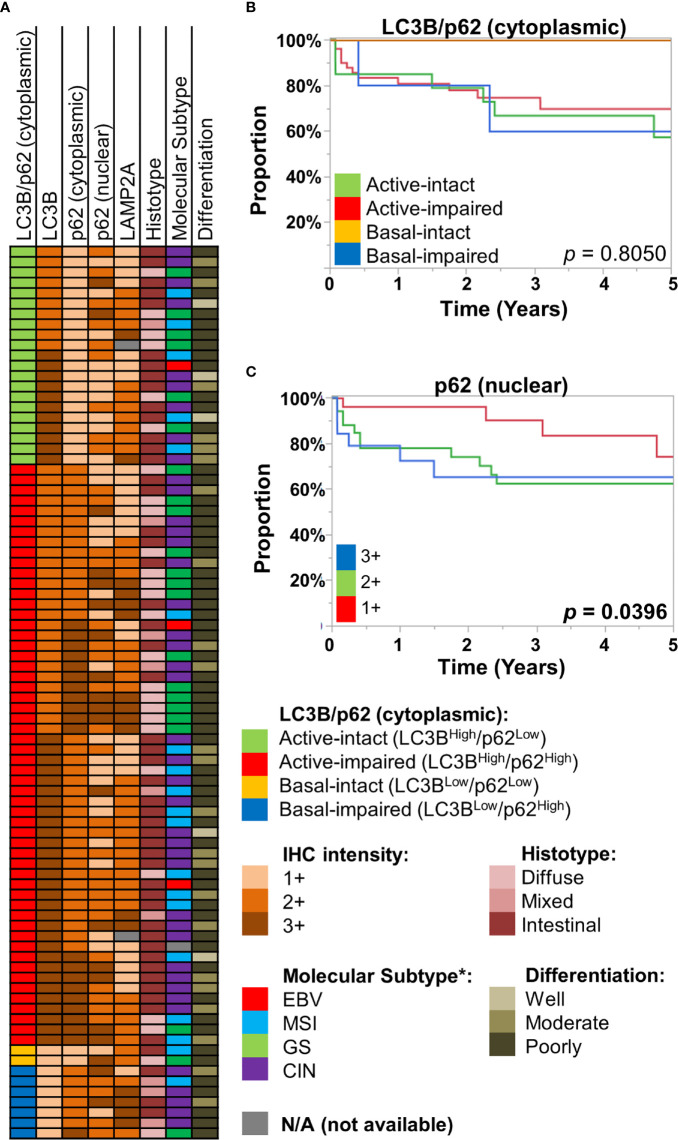
Figure 2.
(A) Case information for the 86 gastric/gastro-esophageal junction (GEJ) adenocarcinoma cases, displaying their LC3B/p62 (cytoplasmic) staining patterns, along with immunohistochemical (IHC) intensity for LC3B, p62 (cytoplasmic, nuclear), and LAMP2A for each case. Also displayed are their respective histotype, approximated TCGA molecular subtype (see Methods), and tumor differentiation. (B, C) Kaplan-Meier curves, showing overall survival of the St. Michael’s gastric/GEJ adenocarcinoma cohort, divided by (B) macroautophagic subtypes (LC3B/cytoplasmic p62), and (C) nuclear p62 intensity.

