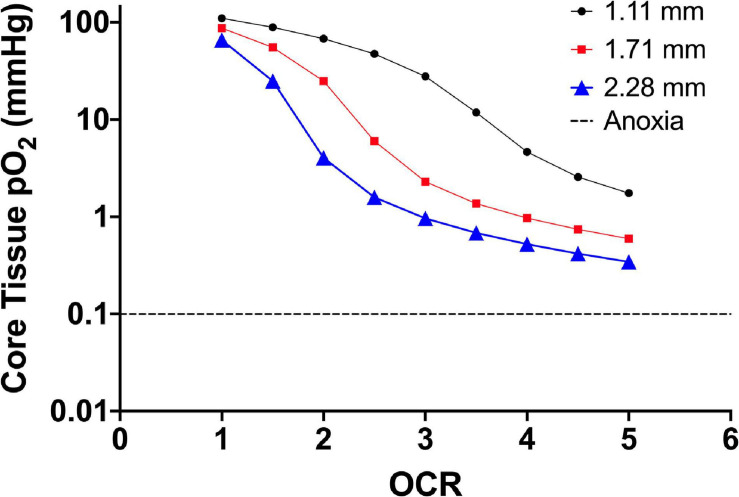
FIGURE 1.
Core tissue oxygen profile of 2D monolayer (20 μm cell diameter) as a factor of culture media height (three different line plots) and increasing OCR (along the x-axis). The decrease in core pO2 corresponds to an increase in OCR along the x-axis and the downward shift in core pO2 is a result of increased media height. The OCR are representative of the published range of most primary endocrine somatic cells and cell lines. The dashed line shows the accepted theoretical cutoff for tissue anoxia and eventual necrotic death in endocrine aggregates.

