FIGURE 4.
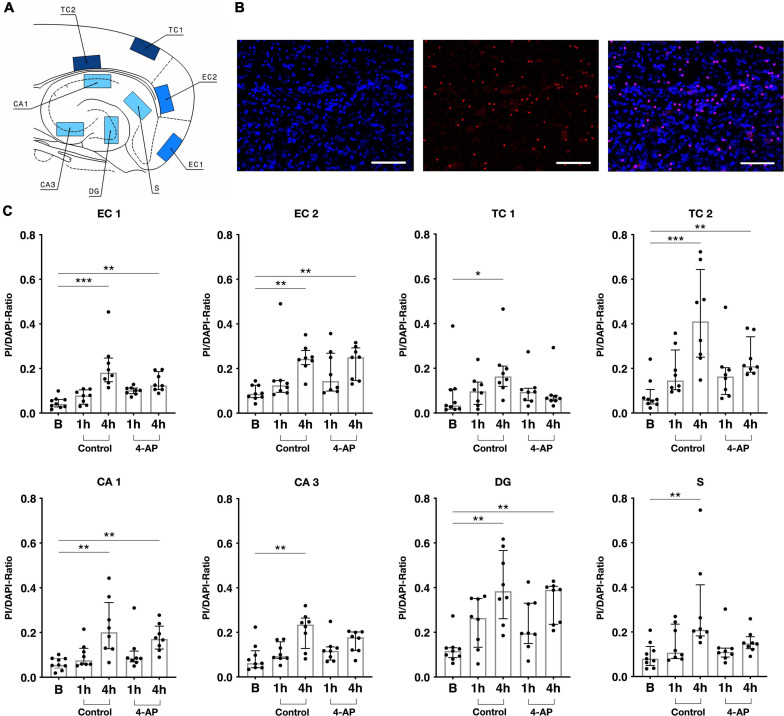
Cell death assay for rat slices. (A) Schematic depiction of a rat slice with eight visual fields (500 × 300 μm) in which cells were counted: two layers of each entorhinal (EC1 and EC2) and temporal cortex (TC1 and TC2) as well as subiculum (S), CA1, C3 and dentate gyrus (DG). (B) Exemplary images acquired by an inverted confocal microscope (20× magnification, merged Z plane image stack), left: DAPI staining (2 μg/ml), in center: PI staining (1 μg/ml), right: merged. Scale bar 100 μm. (C) Slice viability measured as ratio of PI (dead) and DAPI (total) positive cells in n = 41 slices (9 × basal, 8 × control 1 h, 8 × control 4 h, 8 × 4-AP 1 h, 8 × 4-AP 4 h). Scatter plots represent PI/DAPI-Ratio of individually stained slices, superimposed boxes show median ± interquartile range (*p < 0.05, **p < 0.01, ***p < 0.001).

