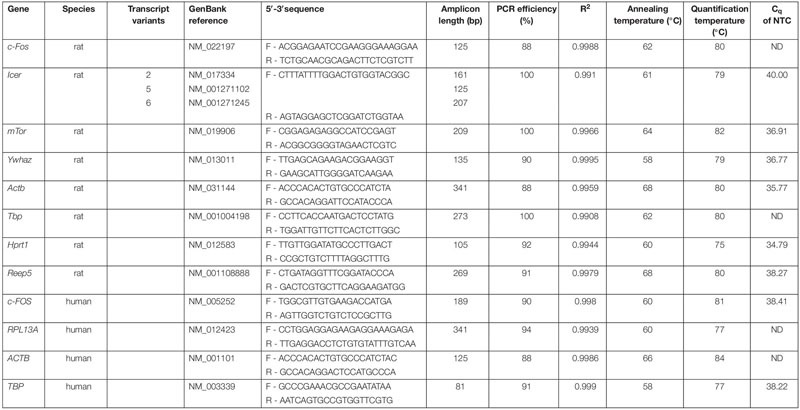
TABLE 1.
Genes and corresponding oligonucleotide primer sequences for qPCR.
 |
Gene name, species of the gene and corresponding primer pair, transcript variants, GenBank reference and sequence of the primers are listed. The table shows also the length of the amplicon for each primer pair. Amplification efficiency and R2 from the standard curve were calculated as described in materials and methods section. Annealing temperature and quantification temperature specific for each primer pair are also listed. F, forward primer; R, reverse primer; bp, base pair; NTC, no template control; ND, not detectable (>40 Cq).
