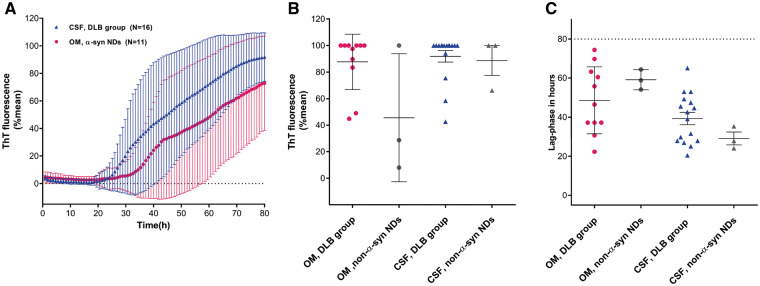
Figure 3.
RT-QuIC detection of α-synuclein seeding activity in patients with DLB and non-α-syn NDs with both OM and CSF samplings. (A) Traces represent the average percentage of thioflavin T (ThT) fluorescence readings from four replicate reactions (normalized as described in the Materials and Methods section), determined in OM (magenta trace) and CSF (blue trace) samples from patients with DLB and DLB/AD mixed dementia (DLB). The means (thick lines) with standard deviations (thin lines) of those averages are shown as a function of RT-QuIC reaction time. (B, C) Final fluorescence values in (B) and lag-phase in (C) of α-syn RT-QuIC positive OM and CSF samples. Samples are grouped in four different classes (OM DLB group, magenta dots, CSF DLB group, blue triangles, OM non-α-syn NDs grey dots and CSF non-α-syn NDs grey triangles). Data points in (B), represent the average percent fluorescence value from four replicate readings obtained for each individual case at 80 h and bars show the mean ± SD for type of case. Data points in (C) show hours required from the mean percentage of ThT fluorescence value from four replicate readings to exceed the threshold for individual cases and bars show the mean ± SD for type of case.

