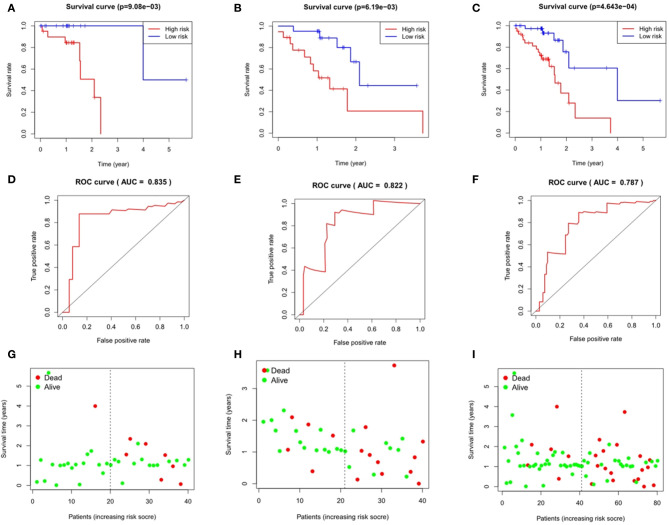
Figure 6.
Evaluation and verification of the model in esophageal squamous cell carcinoma. Kaplan-Meier analysis in high and low risk groups in the train group (A), testing group (B) and entire group (C); ROC curve in the train group (D), testing group (E) and entire group (F); survival status in the train group (G), testing group (H) and entire group (I).

