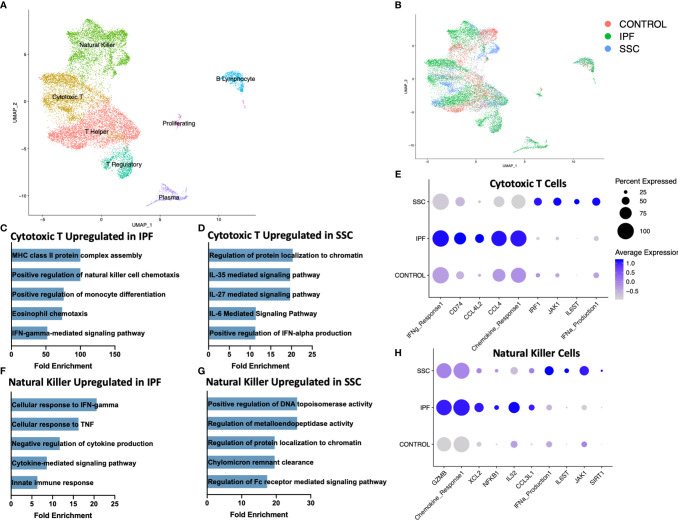
Figure 3.
ScRNA-seq analysis of IPF, SSc-ILD, and control lymphoid populations. (A) UMAP plot of lymphoid subpopulations, identified by cell type. (B) UMAP plot of lymphoid subpopulations, identified by disease status. (C) Pathways upregulated in IPF cytotoxic T cells compared to SSc-ILD cytotoxic T cells. If fold enrichment was calculated as >100 it is depicted as 100 for visualization. (D) Pathways upregulated in SSc-ILD cytotoxic T cells compared to IPF cytotoxic T cells (E) Expression of selected genes and pathways in cytotoxic T cells, separated by disease state. Pathway expression depicted as a module score of all genes in the specific GO biological process. (F) Pathways upregulated in IPF NK cells compared to SSc-ILD NK cells (G) Pathways upregulated in SSc-ILD NK cells compared to IPF NK cells (H) Expression of selected genes and pathways in NK cells, separated by disease state. scRNA-seq, single-cell RNA-sequencing; IPF, idiopathic pulmonary fibrosis; SSc-ILD, systemic sclerosis-associated interstitial lung disease; UMAP, uniform manifold approximation and projection; NK, natural killer.

