
FIGURE 3.
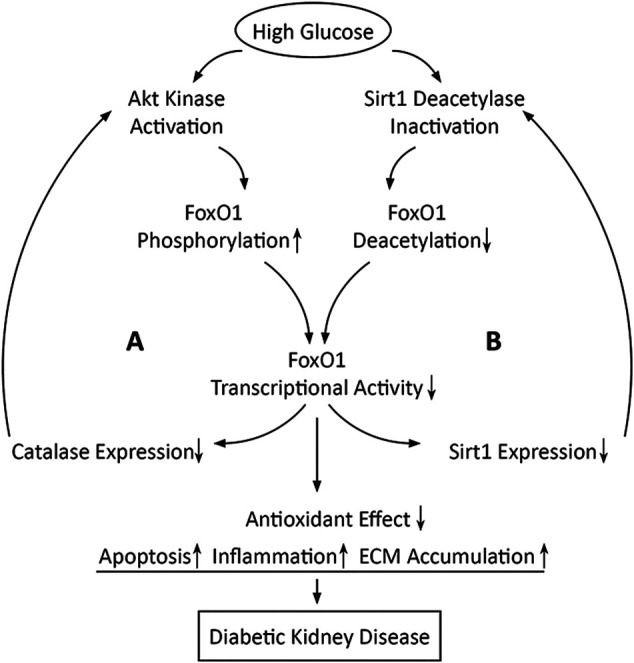
Schematic diagram shows that high glucose may induce two positive feedback loops in which FoxO1 inactivation is involved. Loop A is positive feedback between activation of Akt and inactivation of FoxO1 and loop B is positive feedback between inactivation of Sirt1 and inactivation of FoxO1.