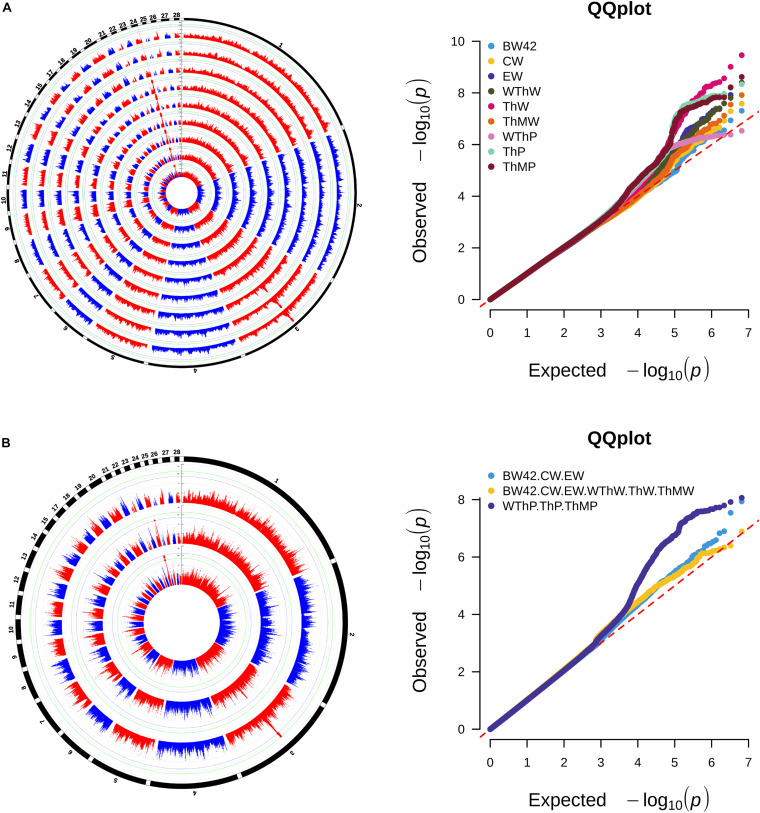
FIGURE 2.
Manhattan and quantile-quantile plots of univariate GWAS (A) and multivariate GWAS (B) for carcass traits. Each dot represents an SNP in the dataset. The circle Manhattan plots from the inside to the outside are BW42, CW, EW, WThW, ThW, ThMW, WThP, ThP, and ThMP. The horizontal blue and green lines indicate the thresholds for genome-wide significance (P-value = 7.64e-9) and suggestive significance (P-value = 1.53e-7), respectively.

